Track Your Shopify Ad Keywords Performance per Store with Google Analytics and HubSpot/(CRM)
5 minutes
Table of Contents
Do you run Shopify Ads for your game changer application? Then, you know how hard to track keyword performance due to Shopify’s limitations. For example, how do you map a search keyword to a paying merchant?
However, by using this methodology, you can learn a more comprehensive view of your Shopify Ads’ performance. If you are ready to learn which customer installed your application by searching a specific keyword, let’s dig in.
Source: gettyimages.com
Why You Should Track Visitors' Behavior?
In today’s world, data is the most powerful tool to manage your business. Understanding each visitor’s intent, and the followed path from the source to the end gives many opportunities to convert visitors into customers.
Additionally, when you can match your visitors with the Shopify Ads analytics, you will be able to understand the quality of the keywords you are bidding on in this competitive environment. For instance, you are bidding on a specific keyword in Shopify Ads and getting many installs for a good CPI. However, you realize many of these potential customers are uninstalling your application after a short time.
Since Shopify Ads does not allow you to know which customer installed your application through search, you can not understand the quality of installs for a specific keyword.
Source: apps.shopify.com
What are you Getting?
You will get an automated tool that you’ll be able to update on a daily/weekly/monthly basis to easily understand the performance of your Shopify ad keywords and match them with your real customers. This tool will help you to see the full journey of each of your leads or customers, and for free.
Step-by-Step Guide: How to Explore Search Terms of Your Shopify Ads & Organic Installers
As explained above, Shopify does not allow applications to match with search queries to the exact person. In other words, when a merchant installs your application, you can not know how they found your application in the Shopify App Store. At PickyStory, we have developed the closest approach to understanding the customer funnel for Shopify App Store installs.
In this guide, we will explain how you can analyze Shopify ads keyword performance by matching visitors’ visit time on your Shopify app listing and visitors’ conversion time in your CRM/Partner account. We are going to follow these 6 steps:
1. Prepare a List of Installs with the Date
2. Exporting Page Visits from Google Analytics
3. Formatting the Time and Hour of the Sessions
4. Matching Installers with the Sessions
5. Extracting the Exact Keyword from the URL
6. Analyze your Search Terms and Search Types
Previous required knowledge: Excel/Google Spreadsheet and Google Analytics
Step 1) Prepare a List of Installs with the Date
The first step of this analysis starts with the list of all of your installers, in other words, customers. There are different alternative ways to prepare this list such as using any CRM tools like HubSpot, SalesForce, or manually downloading the list directly from Shopify Partners.
All you need to do is prepare a list in any CRM tool where you can see: – First name – Last name – Company name – Create a date with a date and time stamp
If you prefer to use Shopify Partners, go to your app and click on the “Export” button after you choose the period you want to analyze.
Source: partners.shopify.com
List of Installers from CRM
Step 2) Exporting Page Visits from Google Analytics
Google Analytics is the most comprehensive web tool for understanding your visitors’ behavior. Additionally, you can set your goals and create your acquisition flows. If you have not integrated your Google Analytics to your Shopify App page, you can learn how here.
Steps to Create Custom Report
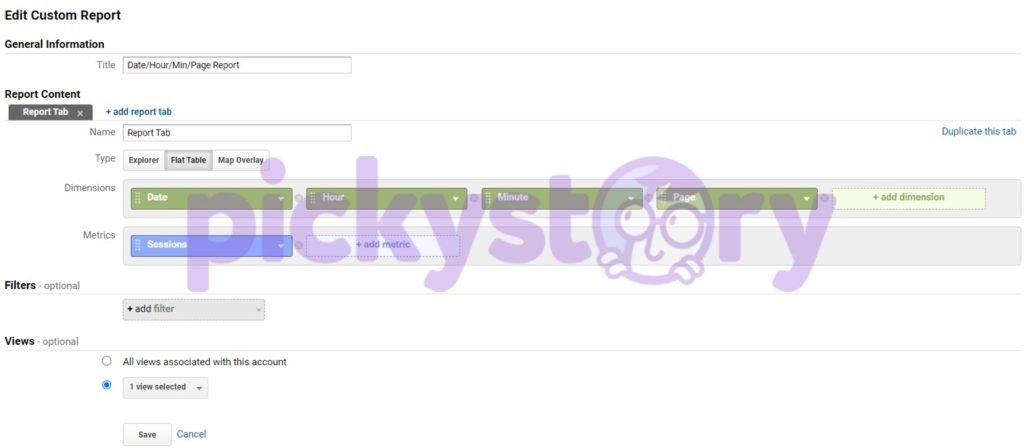
First, you need to prepare a new custom report to find all visited pages with a specific date and time stamp. Go to your Google Analytics where your Shopify App is connected, and click on the “Customization” section on the left. Under the “Custom Reports” tab, you can find the “New Custom Report” button. Here are the steps to prepare the report:
1. Give a title for your custom report
2. Set your report tab name
3. Set “Flat Table” as a type
4. Choose the following dimension in this order: Date – Hour – Minute – Page
5. Choose “Sessions” as a metric
6. Click on the “Save” button
Dimensions & Metrics in Custom Report
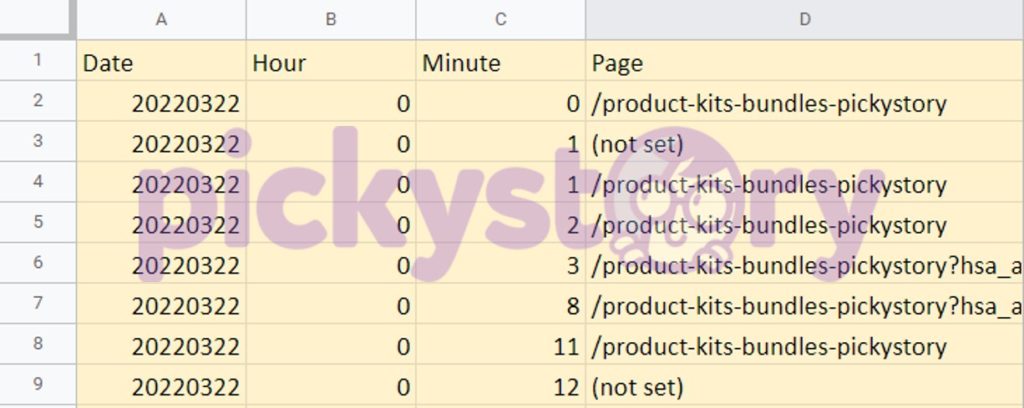
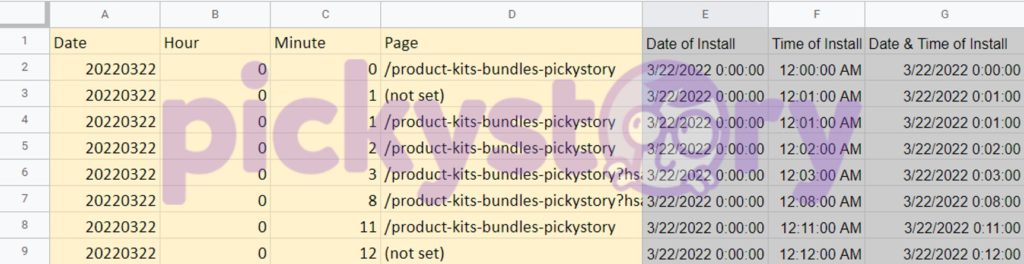
After you create this custom report, choose the date range you want and export. In the file, you will have four columns as chosen above: Column A is Date, Column B is Hour, Column C is Minute, and Column D is Page.
Export of Google Analytics Report
Step 3) Formatting the Time & Hour of the Sessions
Since it requires using the same format in both lists to analyze, after exporting the Google Analytics report, we need to adjust the format. The export file has columns as explained above from A to D. To create DD-MM-YYYY HH: MM format we use DATEVALUE and TIME formulas.
1. Call your Column E as “Date of Install” (Write a title to E1 cell)
2. Use this formula for the rest of the cells in the Colum E
This formula takes the year part (First 4 digits), month part (2 digits in the middle), and the day part (The last 2 digits) to create a time format.
3. Choose Column E and set the data type as “Date & Time” format.
4. Call your Column F as “Time of Install” (Write a title to F1 cell)
5. Use this formula for the rest of the cells in Column F
=TIME(B2,C2,0)
This formula takes the hour from Column B and minute from Column C, then combines them in HH: MM format.
6. Call your Column G as “Date & Time of Install” (Write a title to G1 cell)
7. Use this formula to combine your Install Date and Install Time values
=E2+F2
Automatically, you will get the required format type on your Column G.
Formatting Time & Date Data
Important Note: Before you start the calculations, ensure that two of the data sources have a common time zone, otherwise, you must add the required hour difference by using the TIME formula.
=Source cell + TIME(required number of hours to add, 0, 0)
So far, we have prepared two different lists where one list has the installers (Name and Date) and the second list has the sessions (Page and Date). As you can derive, the date will be the key to matching corresponding names to the pages.
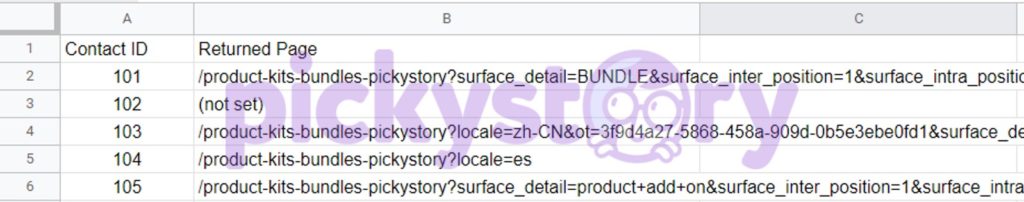
After you have prepared these lists in different tabs on Microsoft Excel or Google Spreadsheet, open a third tab where you will be able to match them with the formula. Since it is expected to have some time between the page visit and install time, we need to find the closest ones. Therefore, using VLOOKUP or EQUALS formulas will mostly fail. The best alternative way is using MATCH/INDEX formulas together.
The first column of the third tab (calculation) should be the list of the installers. The second column should have the MATCH/INDEX formula with ArrayFormula.
Here is the formula you need:
=ArrayFormula(index(List of the Pages exported from Google Analytics, match(Min(ABS(List of the times exported from Google Analytics-List of the times exported Shopify/CRM)), ABS(List of the times exported from Google Analytics-List of the times exported Shopify/CRM),0)))
By using the ABS (absolute) formula, we are ensuring the time difference is always a positive number since time can not be a negative value.
This formula compares each install’s date with the session times one by one by finding the absolute differences and returns the closest time’s page. As we should consider, this is not the optimal way to find the page, however, this approach gives us the most feasible solution.
After these four steps, you will be able to see the page for each install, however, some of the pages might be “(not set)” due to Google Analytics privacy policy restrictions.
Result of Return Array per Contact
Step 5) Extracting the Exact Keyword from the URL
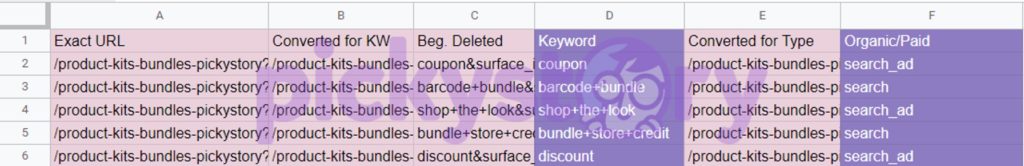
After this point, the rest of the steps are optional but will help you to see keywords much easier. Since the search terms are already in the URLs, you just need to extract them alone into another cell.
Here, we will show how to extract the search term, and the click type which can be either Shopify Paid Ads or Organic. If you are familiar with the Shopify URL Structure, you know that the search term is written after “surface_detail=” and the type is written after “surface_type=”.
1. Create another tab in the same sheet called “Keywords” or give another name.
2. Fill Column A with the exact URLs you have obtained from step 4.
3. In Colum B, substitute the “surface_detail=” with a unique character such as asterisks “*”.
=SUBSTITUTE(A2,"surface_detail=","*")
4. In Column C, you can delete all the characters until the unique letter. (“*” for our case)
=IFERROR(RIGHT(B2,LEN(B2)-FIND("*",B2)),"N/A")
5. Then, you also need to remove everything from the last part of the URL until it comes to the search term. In Column D, you can delete everything until the “&” letter since the URL contains different parameters combined with “&”.
=IFERROR(LEFT(C2,FIND("&",C2)-1),"N/A")
6. To find click type, we use the same strategy as keywords. Substitute “surface_type=” with a unique character such as “*” in Column E.
7. Then finally, in Column F, you can remove everything until the URL hits the unique character (in our case, it is “*”)
=IFERROR(RIGHT(E2,LEN(E2)-FIND("*",E2)),"N/A")
Since the type is written at the end of the URL, you don’t need to remove any other text.
Keyword & Search Type of each Installer
Step 6) Analyze your Search Terms and Search Types
When you successfully follow the first five steps above, Column D will have the search term, and Column F will have the search type.
Take these values somewhere else to work on a clean page and look at their installers. Now, you have everything you need to match the corresponding installer to the search term and search type.
Now, you can evaluate each keyword not with the quantity but also with the quality level.
Download the Free Keyword Matching Tool
Enter your name & email address, and we will deliver the file to your inbox!
Present bundles of products that are frequently purchased together, simplifying the decision-making process for your customers
What is Frequently Bought Together?
It is a recommendation scenario that suggests additional products to the shopper, which are often purchased by other customers in conjunction with the item they are currently viewing or considering purchasing.
Why are brands using it?
Boosted sales and revenue - increases average order value by suggesting complementary products, leading to higher sales
Simplified customer experience - saves time and effort for customers by offering relevant product recommendations, enhancing satisfaction and loyalty
Cross-selling opportunities: "Frequently Bought Together" creates opportunities for cross-selling, allowing brands to introduce shoppers to a wider range of products
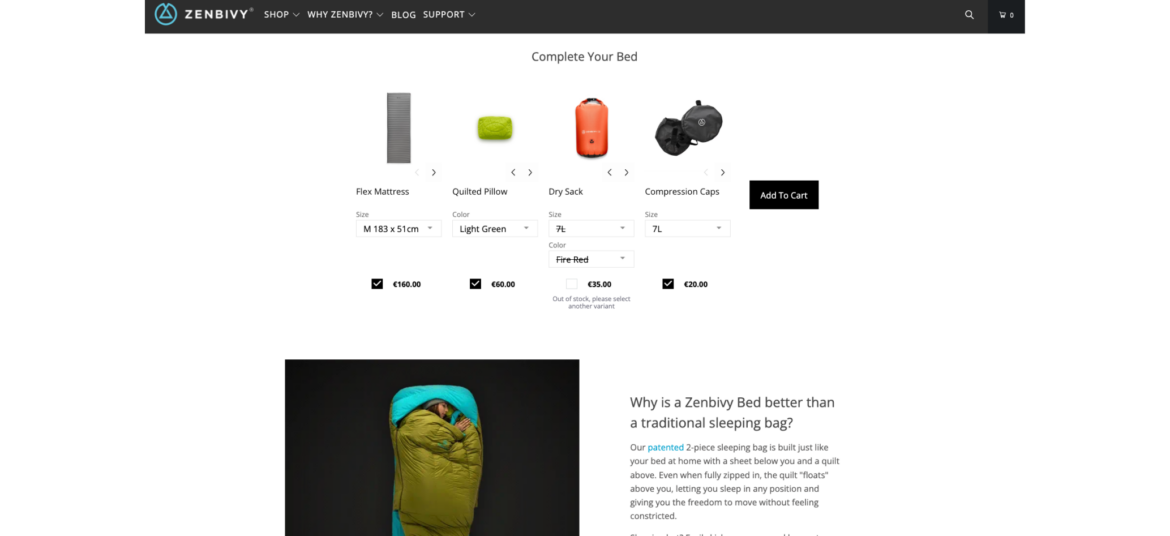
How Zenbivy uses Frequently Bought Together
Zenbivy simplifies the shopping experience by displaying all the needed pieces of its sleeping systems on one page, under each product that is part of a sleeping system. This way, shoppers don't need to go through multiple pages and guess what goes with what. Zenbivy enjoys much larger orders, and shoppers can have a seamless experience.
Offer shoppers the ability to create their own bundle of products by selecting from a range of available options
What is Build Your Own Bundle?
Build Your Own Bundle scenario provides shoppers with the flexibility to select specific items or features that best meet their individual needs and preferences. The selection is based on a pre-curated set of products by the merchant.
Why are brands using it?
Increase AOV - encourage higher spending with customizable bundles, raising average order values and revenue
Personalize purchases - tailor products to customer preferences, potentially increasing Average Order Value (AOV) and overall revenue
Stand out competitively - offer a unique option, attracting customers looking for customized solutions
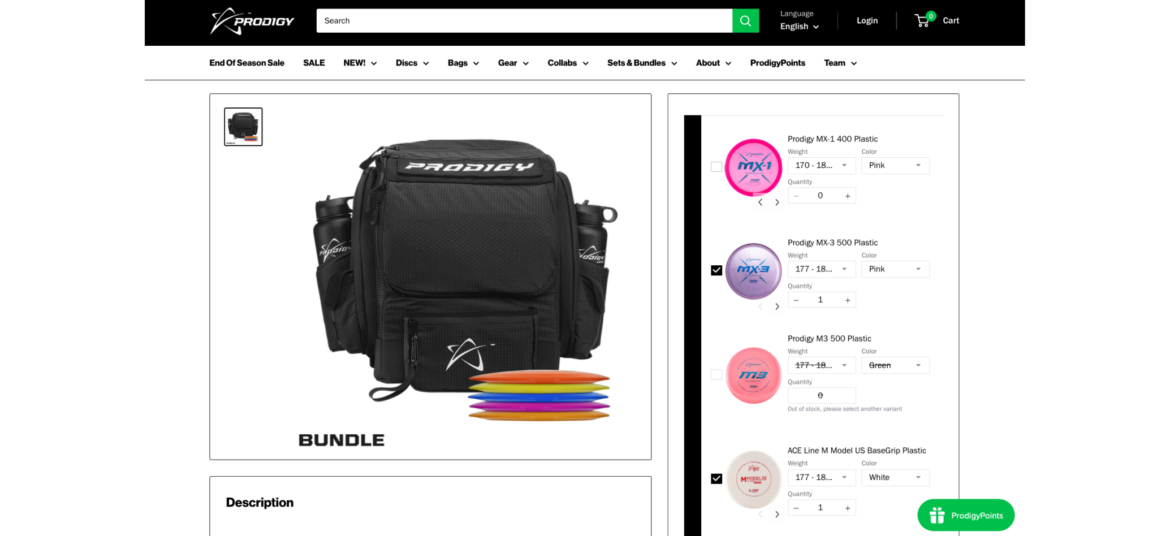
How Prodigy uses Build Your Own Bundle
Prodigy enables its shoppers to build their own bundle of golf discs, fully personalizing the shopping experience. Shoppers get an easy way to select their favorite discs while Prodigy consistently increases its AOV.
Combine multiple individual products into a bundle and sell them as a single unit
What is Bundle as Product?
Bundle as Product scenario involves bundling multiple individual products together and selling them as a single unit. This strategy offers shoppers a curated selection of items that work together or complement each other.
Why are brands using it?
Increase sales and revenue. Bundling leads to higher sales volumes and greater revenue due to the perceived cost-effectiveness.
Highlight the value and convenience of purchasing a set of items together, enticing them with an irresistible offer
Enhance value perception. Bundles create the perception of added value, making them more appealing to customers.
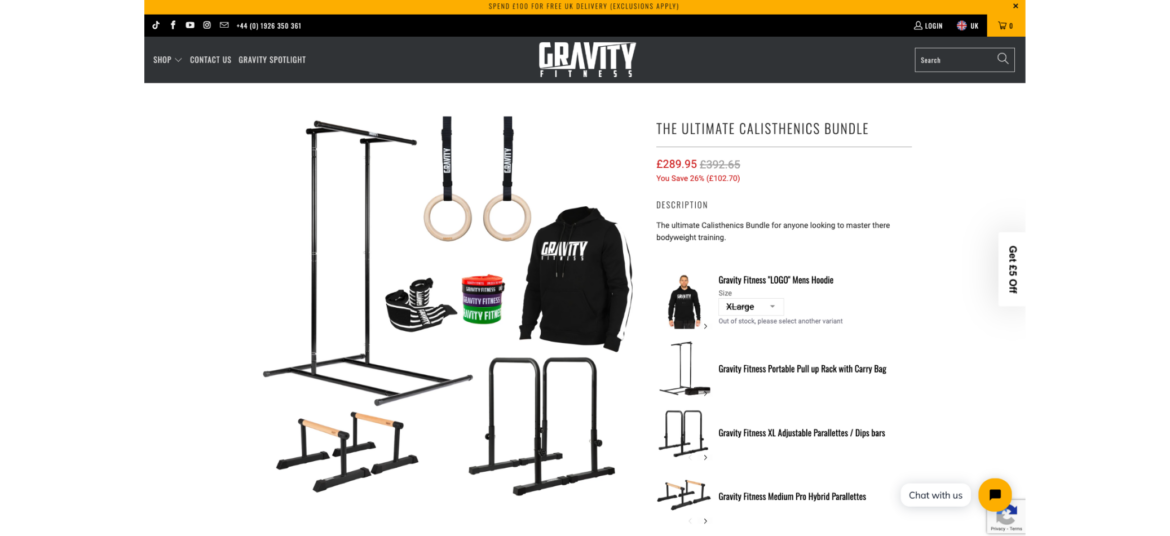
How Gravity Fitness uses Bundle as Product
Gravity Fitness knows that it's not an easy task for shoppers to collect all the required pieces for a complete home gym. That's why they have created pre-made home gym bundles for an easy shopping experience. Now they have fewer SKU issues, a higher AOV, and happier customers.
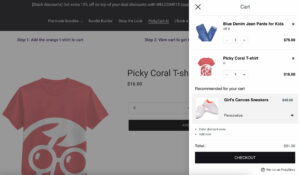
Encourage shoppers to add the missing items to complete the bundle when they add items to cart
What is Complete the Bundle?
Complete the Bundle popup is a deal that appears when a shopper has added some items to their shopping cart but has not yet added all the recommended or related products that typically go together.
Why are brands using it?
Increase Average Order Value (AOV) - encourage shoppers to add complementary products, leading to higher total purchases
Highlight the value and convenience of purchasing a set of items together, enticing them with an irresistible offer
Enhance value perception. Bundles create the perception of added value, making them more appealing to customers.
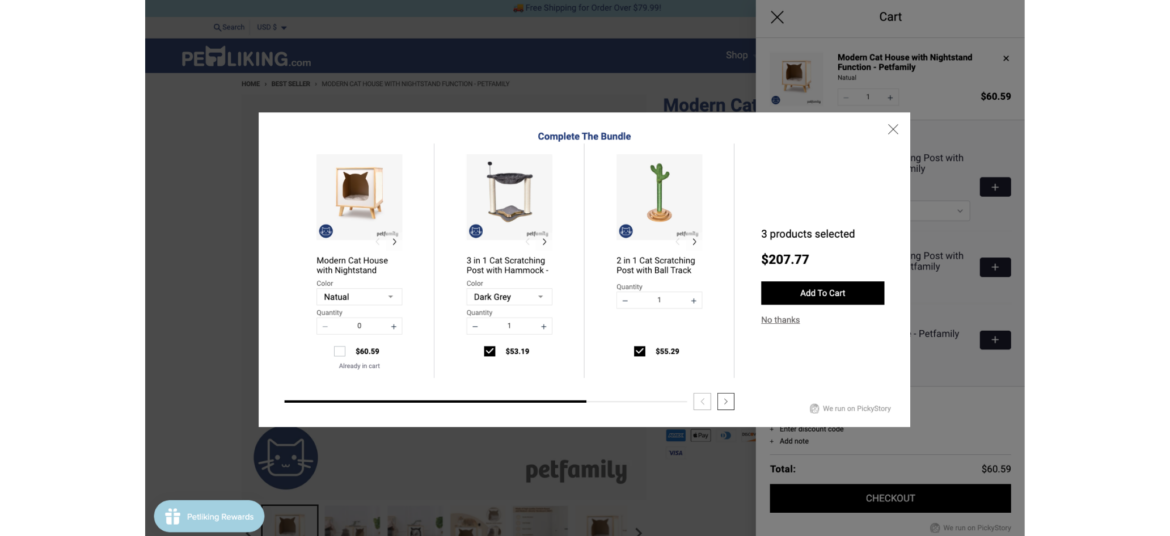
How Petliking.com uses Complete the Bundle
Petliking.com never misses an opportunity to offer more products to its shoppers after they add an item to cart. By offering to complete the bundle, Petliking.com helps shoppers to discover additional related items that complement each other while increasing its order size.
Combine multiple individual products into a bundle and sell them as a single unit
What is Bundle as Product?
Bundle as Product scenario involves bundling multiple individual products together and selling them as a single unit. This strategy offers shoppers a curated selection of items that work together or complement each other.
Why are brands using it?
Increase sales and revenue. Bundling leads to higher sales volumes and greater revenue due to the perceived cost-effectiveness.
Highlight the value and convenience of purchasing a set of items together, enticing them with an irresistible offer
Enhance value perception. Bundles create the perception of added value, making them more appealing to customers.
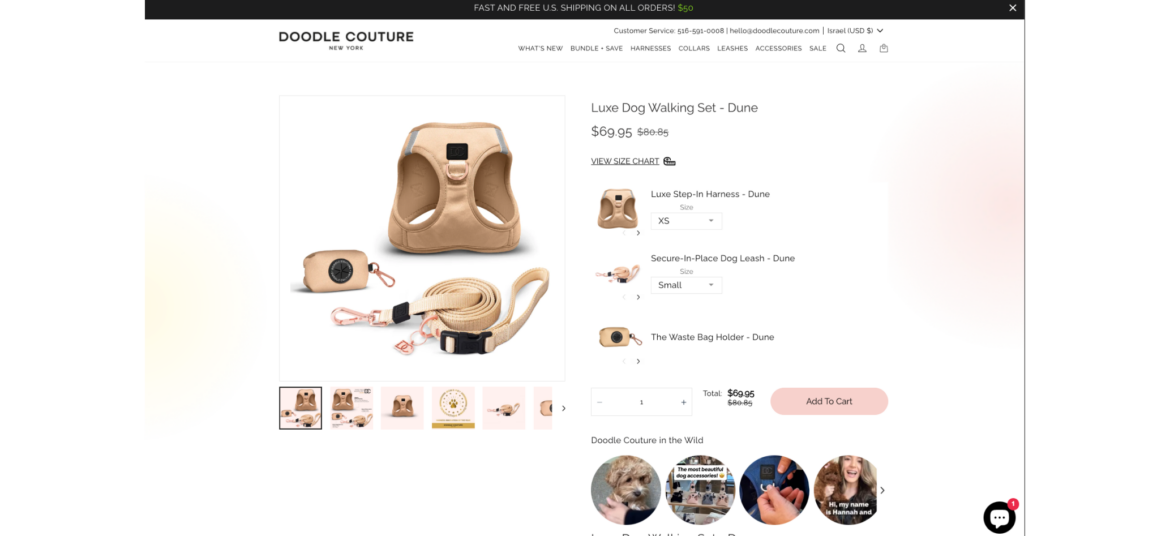
How Doodle Couture uses Bundle as Product
Doodle Couture makes it so easy for shoppers to equip their best friend with the required outfit. Instead of moving back and forth between pages, Doodle Couture offer a complete bundle for pets on one page with a single click. This boosts AOV while making the shopper happy.
Encourage shoppers to add the missing items to complete the bundle when they add items to cart
What is Complete the Bundle?
Complete the Bundle popup is a deal that appears when a shopper has added some items to their shopping cart but has not yet added all the recommended or related products that typically go together.
Why are brands using it?
Increase Average Order Value (AOV) - encourage shoppers to add complementary products, leading to higher total purchases
Highlight the value and convenience of purchasing a set of items together, enticing them with an irresistible offer
Enhance value perception. Bundles create the perception of added value, making them more appealing to customers.
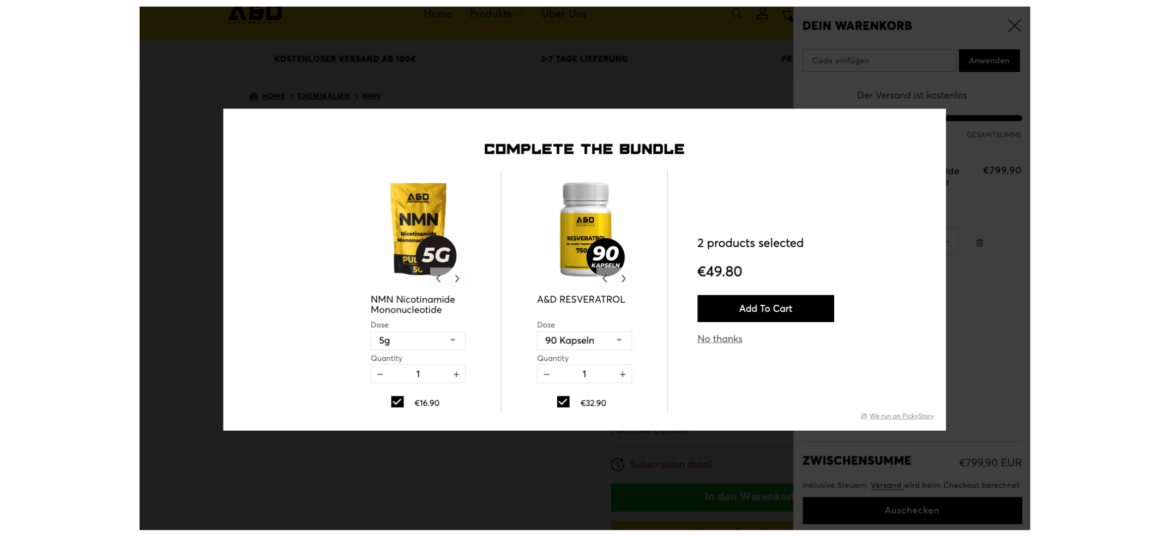
How A&D Performance uses Complete the Bundle
A&D Performance always seizes intent-based opportunities to offer additional supplements when shoppers add items to their cart. By displaying a 'Complete the Bundle' popup, A&D Performance increases their Average Order Value (AOV) while helping their customers discover more products.
Combine multiple individual products into a bundle and sell them as a single unit
What is Bundle as Product?
Bundle as Product scenario involves bundling multiple individual products together and selling them as a single unit. This strategy offers shoppers a curated selection of items that work together or complement each other.
Why are brands using it?
Increase sales and revenue. Bundling leads to higher sales volumes and greater revenue due to the perceived cost-effectiveness.
Highlight the value and convenience of purchasing a set of items together, enticing them with an irresistible offer
Enhance value perception. Bundles create the perception of added value, making them more appealing to customers.
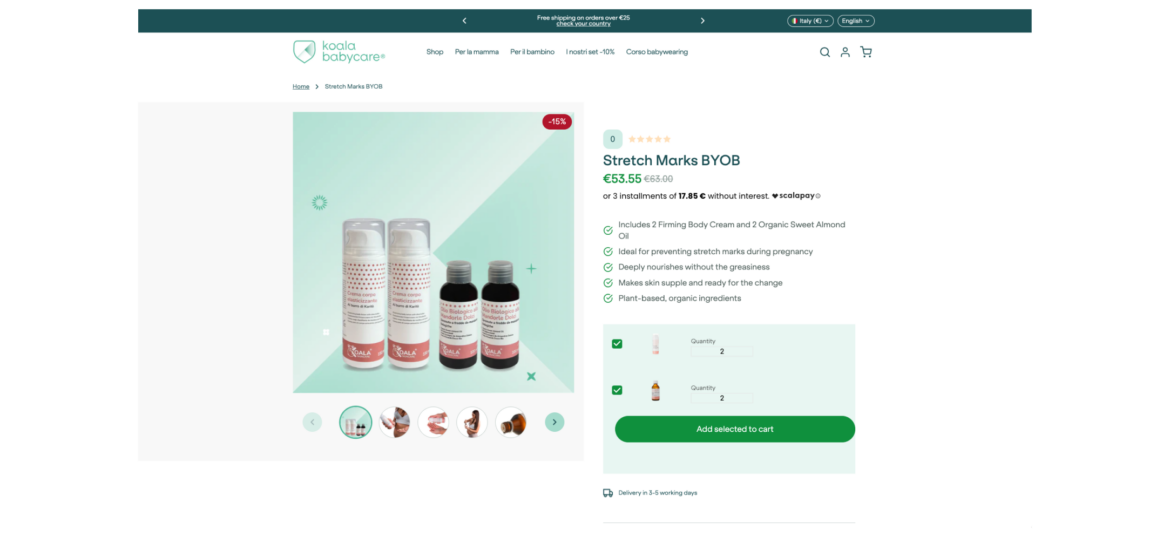
How Koala Babycare uses Bundle as Product
Koala Babycare simplifies its shoppers lives by offering complete cream & oil sets. Shoppers can easily pick their favorite bundles and save while Koala Babycare increases its AOV and number of orders.
Encourage shoppers to spend a certain amount of money (X) in order to receive a specific benefit or reward (Y)
What is Spend X Get Y?
"Spend X, Get Y" promotions are designed to motivate shoppers to spend more money with the promise of receiving something valuable in return. It's a win-win situation where customers get a benefit, and the store increases its sales.
Why are brands using it?
Promotes larger purchases - motivates shoppers to spend more to qualify for the promotion, potentially leading to bigger transactions
Increases Average Order Value (AOV) - encourages higher spending, leading to a higher average transaction value
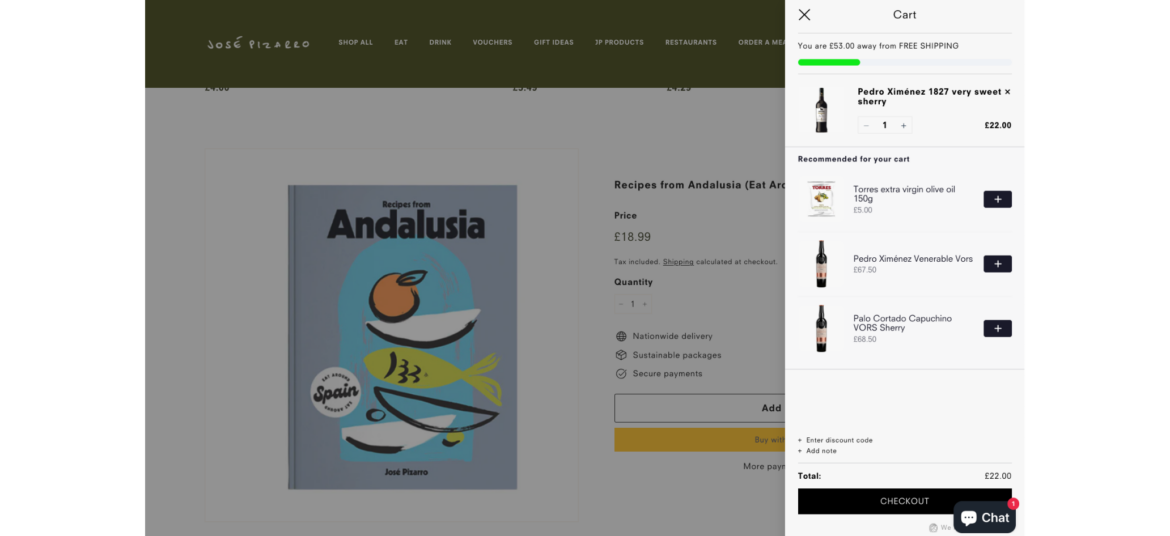
Jose Pizarro takes advantage of PickyCart and 'Spend X Get Y' to reward shoppers with free shipping when they spend £75 in-store. This is a win-win offer for both sides - while Jose Pizarro increases the AOV, shoppers receive a sweet reward.
Encourage shoppers to add the missing items to complete the bundle when they add items to cart
What is Complete the Bundle?
Complete the Bundle popup is a deal that appears when a shopper has added some items to their shopping cart but has not yet added all the recommended or related products that typically go together.
Why are brands using it?
Increase Average Order Value (AOV) - encourage shoppers to add complementary products, leading to higher total purchases
Highlight the value and convenience of purchasing a set of items together, enticing them with an irresistible offer
Enhance value perception. Bundles create the perception of added value, making them more appealing to customers.
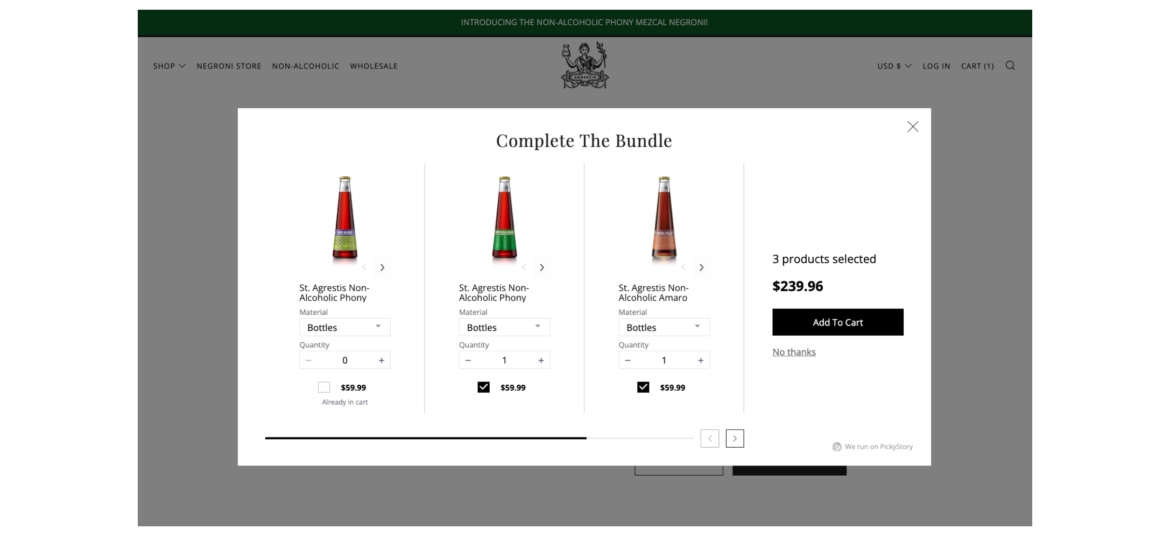
How Agrestis uses Complete the Bundle
Agrestis makes sure to consistently display a variety of spirits to their shoppers at the right moment. As shoppers add spirits to the cart, Agrestis extends an offer to include more related spirits, resulting in an improved shopping experience and a higher Average Order Value (AOV).
Offer shoppers the ability to create their own bundle of products by selecting from a range of available options
What is Build Your Own Bundle?
Build Your Own Bundle scenario provides shoppers with the flexibility to select specific items or features that best meet their individual needs and preferences. The selection is based on a pre-curated set of products by the merchant.
Why are brands using it?
Increase AOV - encourage higher spending with customizable bundles, raising average order values and revenue
Personalize purchases - tailor products to customer preferences, potentially increasing Average Order Value (AOV) and overall revenue
Stand out competitively - offer a unique option, attracting customers looking for customized solutions
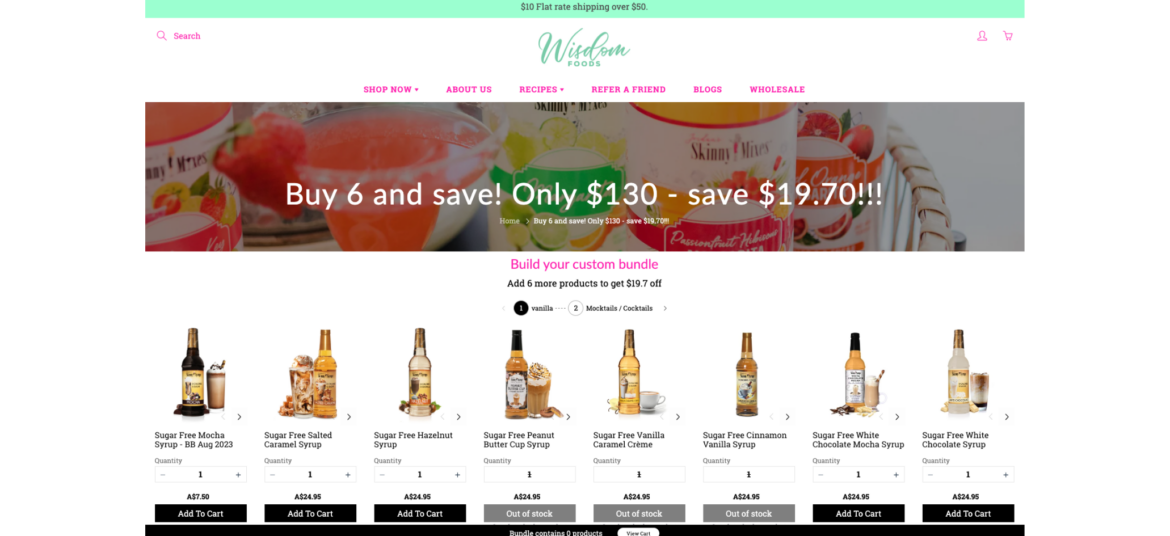
How Wisdom Foods uses Build Your Own Bundle
Wisdom Foods wanted to upgrade its shopping experience by making it easy for shoppers to pick their desired syrups. Now it allows shoppers to build their own bundles of syrups from a single page and checking out. This increases Wisdom Foods' order sizes while providing a personalized experience to their shoppers.
Combine multiple individual products into a bundle and sell them as a single unit
What is Bundle as Product?
Bundle as Product scenario involves bundling multiple individual products together and selling them as a single unit. This strategy offers shoppers a curated selection of items that work together or complement each other.
Why are brands using it?
Increase sales and revenue. Bundling leads to higher sales volumes and greater revenue due to the perceived cost-effectiveness.
Highlight the value and convenience of purchasing a set of items together, enticing them with an irresistible offer
Enhance value perception. Bundles create the perception of added value, making them more appealing to customers.
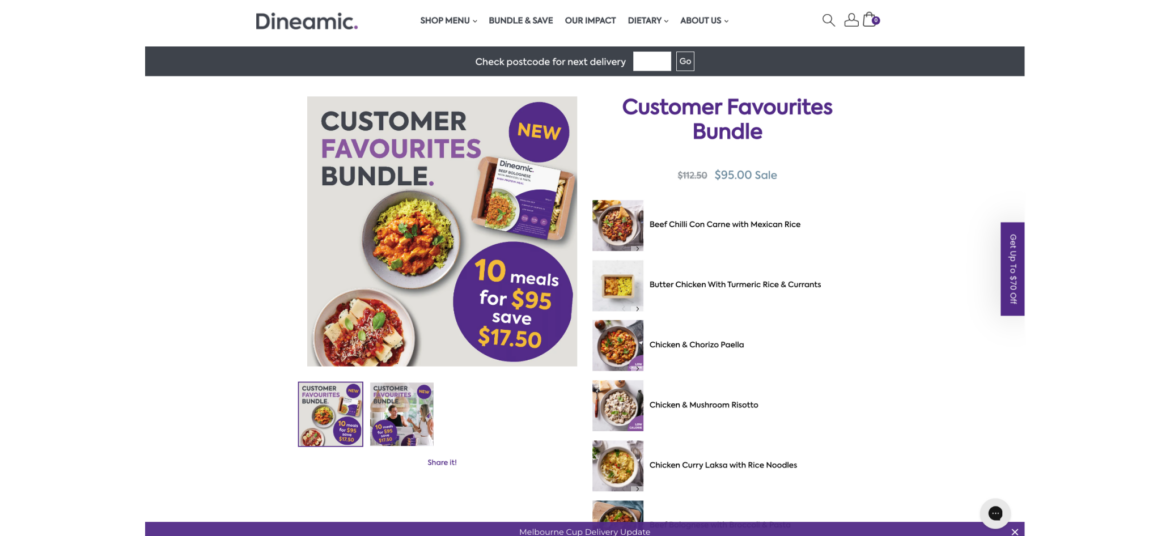
How Dineamic uses Bundle as Product
Dineamic takes advantage of bundles to package their pre-made meals by dietary requirements, so every shopper can quickly and easily find the desired category of meals and add them all with a single click. This simplifies the shopping experience and benefits both sides, as Dineamic boosts its Average Order Value (AOV).
Combine multiple individual products into a bundle and sell them as a single unit
What is Bundle as Product?
Bundle as Product scenario involves bundling multiple individual products together and selling them as a single unit. This strategy offers shoppers a curated selection of items that work together or complement each other.
Why are brands using it?
Increase sales and revenue. Bundling leads to higher sales volumes and greater revenue due to the perceived cost-effectiveness.
Highlight the value and convenience of purchasing a set of items together, enticing them with an irresistible offer
Enhance value perception. Bundles create the perception of added value, making them more appealing to customers.
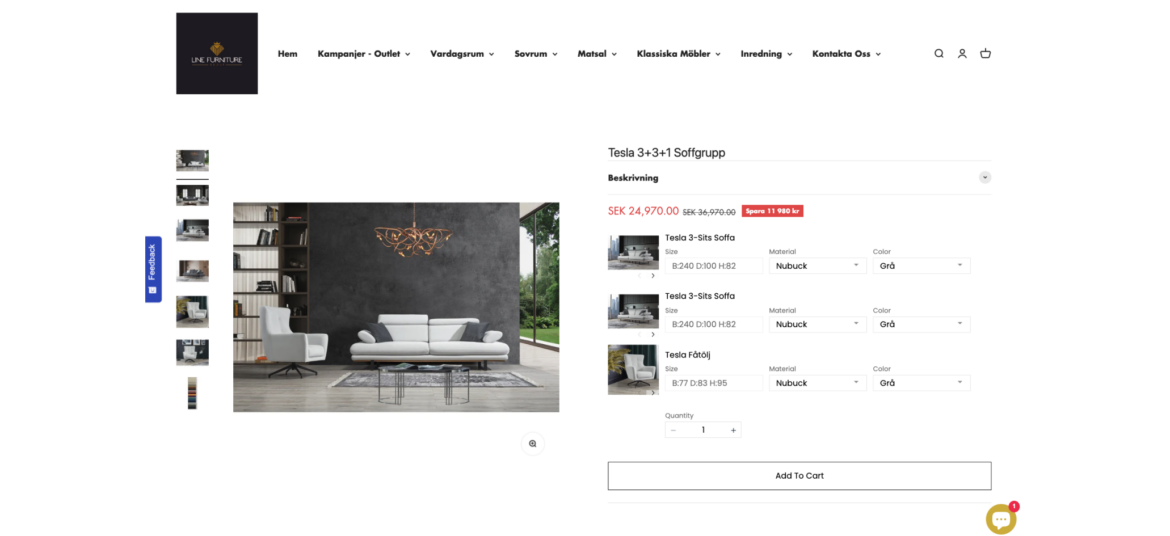
How Line Furniture uses Bundle as Product
Line furniture simplifies its shoppers lives by offering complete furniture sets in different styles. Now shoppers can easily find their favorite living room and save while Line Furniture increases its AOV and number of orders.
Encourage shoppers to add the missing items to complete the bundle when they add items to cart
What is Complete the Bundle?
Complete the Bundle popup is a deal that appears when a shopper has added some items to their shopping cart but has not yet added all the recommended or related products that typically go together.
Why are brands using it?
Increase Average Order Value (AOV) - encourage shoppers to add complementary products, leading to higher total purchases
Highlight the value and convenience of purchasing a set of items together, enticing them with an irresistible offer
Enhance value perception. Bundles create the perception of added value, making them more appealing to customers.
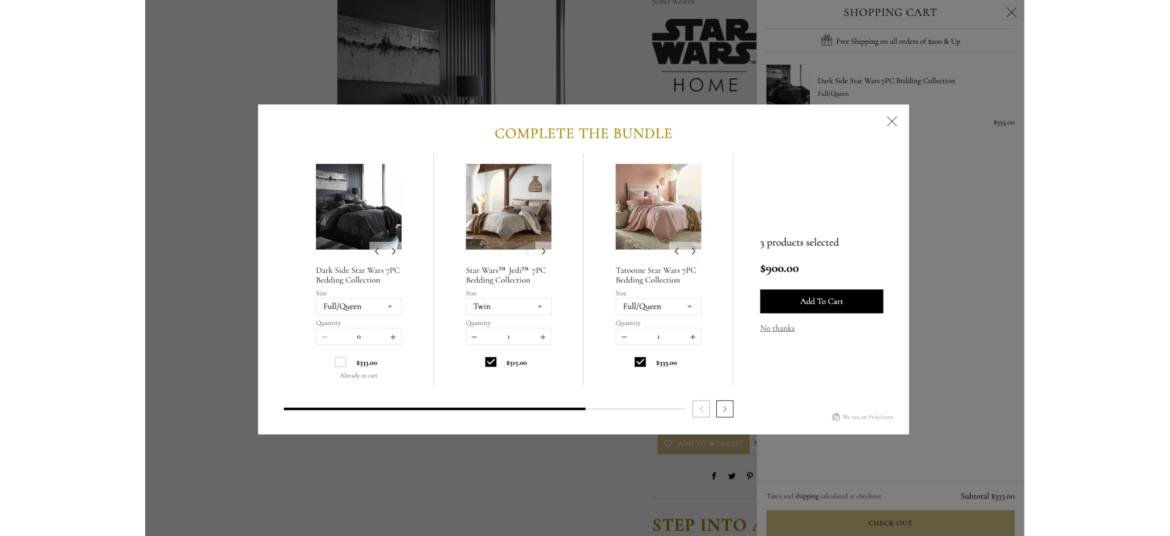
How Sobel Home uses Complete the Bundle
Sobel Home never misses an opportunity to offer more products to its shoppers after they add an item to cart. By offering to complete the bundle, Sobel Home helps shoppers to discover additional related items that complement each other while increasing its order size.
Present bundles of products that are frequently purchased together, simplifying the decision-making process for your customers
What is Frequently Bought Together?
It is a recommendation scenario that suggests additional products to the shopper, which are often purchased by other customers in conjunction with the item they are currently viewing or considering purchasing.
Why are brands using it?
Boosted sales and revenue - increases average order value by suggesting complementary products, leading to higher sales
Simplified customer experience - saves time and effort for customers by offering relevant product recommendations, enhancing satisfaction and loyalty
Cross-selling opportunities: "Frequently Bought Together" creates opportunities for cross-selling, allowing brands to introduce shoppers to a wider range of products
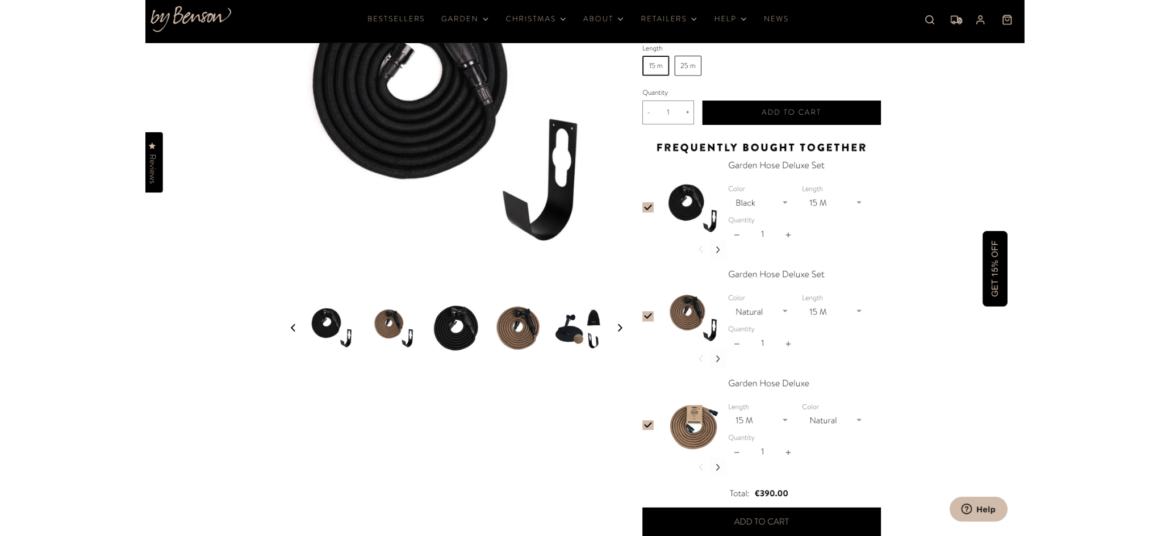
How By Benson uses Frequently Bought Together
By Benson never misses an opportunity to offer more options to its customers. While shoppers visit their product pages, they constantly offer to extend or upgrade the targeted product, resulting in better service and larger orders.
Offer shoppers the ability to create their own bundle of products by selecting from a range of available options
What is Build Your Own Bundle?
Build Your Own Bundle scenario provides shoppers with the flexibility to select specific items or features that best meet their individual needs and preferences. The selection is based on a pre-curated set of products by the merchant.
Why are brands using it?
Increase AOV - encourage higher spending with customizable bundles, raising average order values and revenue
Personalize purchases - tailor products to customer preferences, potentially increasing Average Order Value (AOV) and overall revenue
Stand out competitively - offer a unique option, attracting customers looking for customized solutions
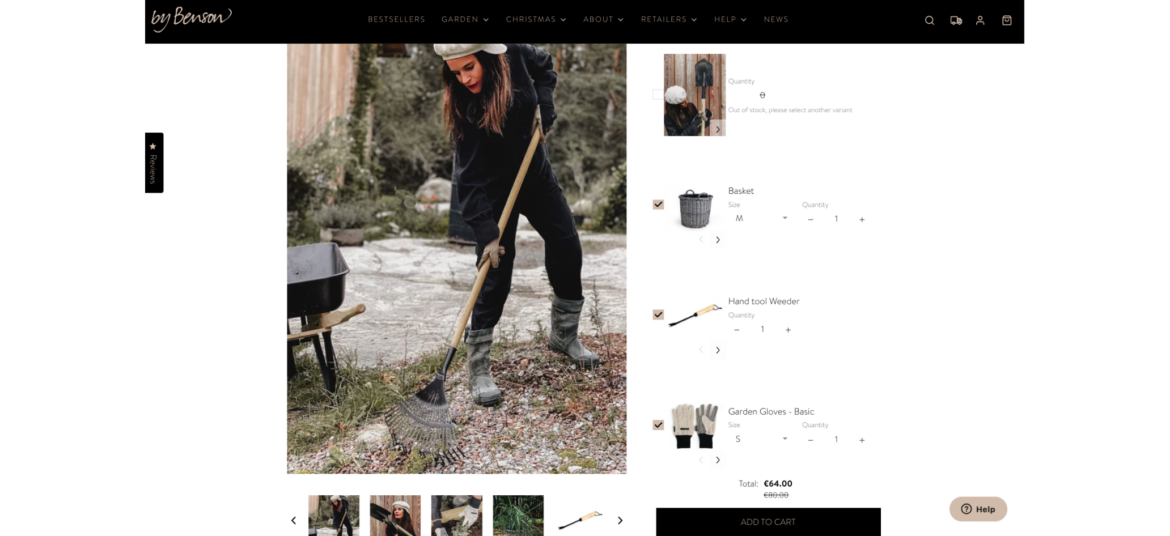
How By Benson uses Build Your Own Bundle
As a professional destination for home gardeners, By Benson understands that it might be tricky to select all the necessary tools to make your garden shine. That's why By Benson helps its shoppers choose bundles of tools with a single click, while boosting their Average Order Value (AOV).
Offer shoppers the ability to create their own bundle of products by selecting from a range of available options
What is Build Your Own Bundle?
Build Your Own Bundle scenario provides shoppers with the flexibility to select specific items or features that best meet their individual needs and preferences. The selection is based on a pre-curated set of products by the merchant.
Why are brands using it?
Increase AOV - encourage higher spending with customizable bundles, raising average order values and revenue
Personalize purchases - tailor products to customer preferences, potentially increasing Average Order Value (AOV) and overall revenue
Stand out competitively - offer a unique option, attracting customers looking for customized solutions
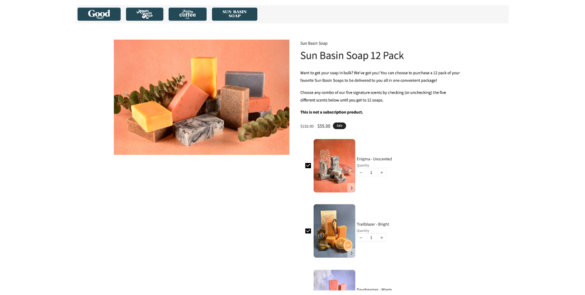
How Good Store uses Build Your Own Bundle
Good Store encourages its shoppers to build their own custom bundles of soaps. They provide a variety of soaps to choose from and leave the selection itself to the shopper. This is fun, rewarding, and makes both sides happy.
Combine multiple individual products into a bundle and sell them as a single unit
What is Bundle as Product?
Bundle as Product scenario involves bundling multiple individual products together and selling them as a single unit. This strategy offers shoppers a curated selection of items that work together or complement each other.
Why are brands using it?
Increase sales and revenue. Bundling leads to higher sales volumes and greater revenue due to the perceived cost-effectiveness.
Highlight the value and convenience of purchasing a set of items together, enticing them with an irresistible offer
Enhance value perception. Bundles create the perception of added value, making them more appealing to customers.
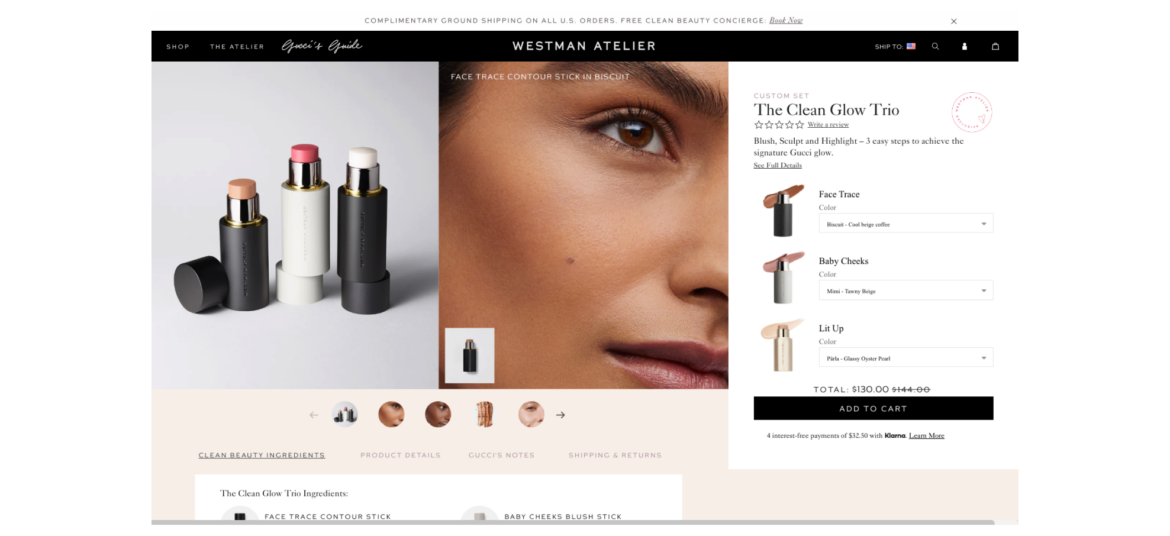
How Westman Atelier uses Bundle as Product
Westman Atelier understands that the attention span of the average shopper is quite short. Furthermore, with numerous options available, it's often easier to opt for a suggested bundle that's already curated for you.
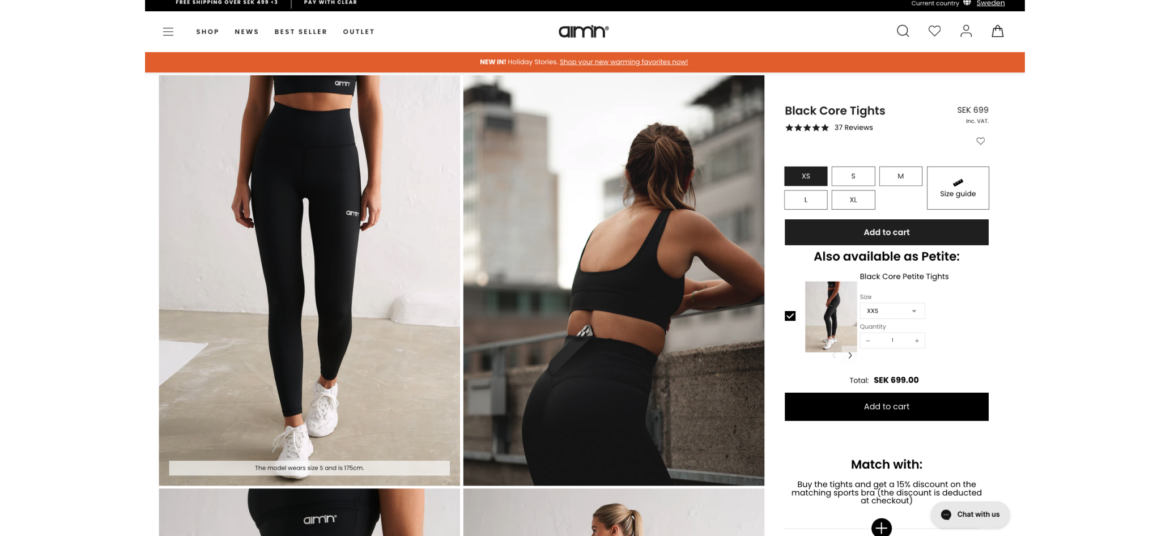
Present bundles of products that are frequently purchased together, simplifying the decision-making process for your customers
What is Frequently Bought Together?
It is a recommendation scenario that suggests additional products to the shopper, which are often purchased by other customers in conjunction with the item they are currently viewing or considering purchasing.
Why are brands using it?
Boosted sales and revenue - increases average order value by suggesting complementary products, leading to higher sales
Simplified customer experience - saves time and effort for customers by offering relevant product recommendations, enhancing satisfaction and loyalty
Cross-selling opportunities: "Frequently Bought Together" creates opportunities for cross-selling, allowing brands to introduce shoppers to a wider range of products
How Aim’n uses Frequently Bought Together
Aim'n never misses a shopper when it comes to its product pages. It utilizes the 'Frequently Bought Together' feature to suggest additional sizes to product viewers, ensuring that no shopper is left without a solution while keeping its main sizes as the default option.
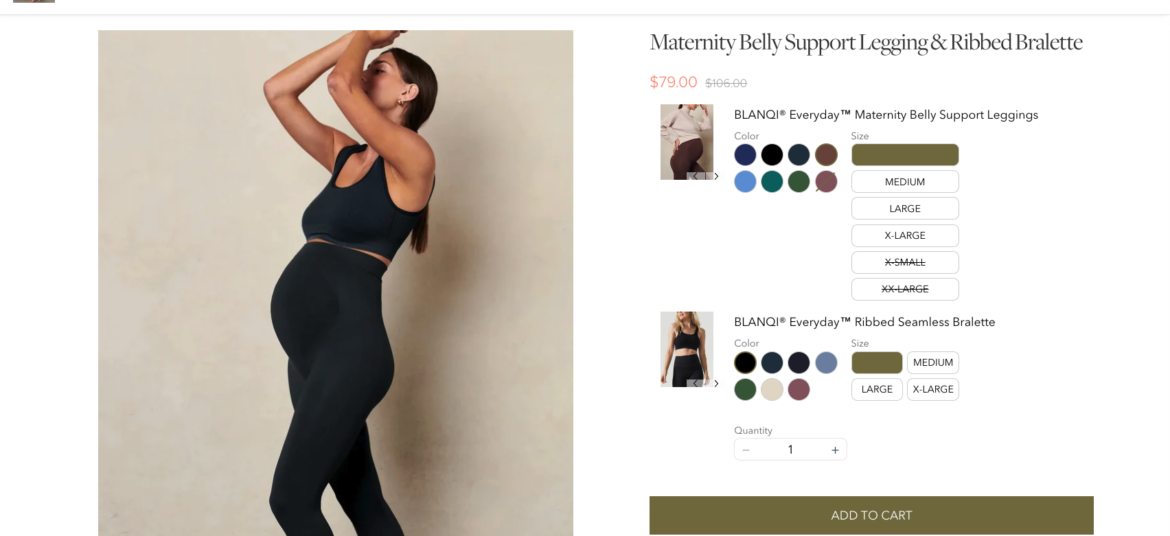
Combine multiple individual products into a bundle and sell them as a single unit
What is Bundle as Product?
Bundle as Product scenario involves bundling multiple individual products together and selling them as a single unit. This strategy offers shoppers a curated selection of items that work together or complement each other.
Why are brands using it?
Increase sales and revenue. Bundling leads to higher sales volumes and greater revenue due to the perceived cost-effectiveness.
Highlight the value and convenience of purchasing a set of items together, enticing them with an irresistible offer
Enhance value perception. Bundles create the perception of added value, making them more appealing to customers.
How BLANQI uses Bundle as Product
BLANQI make it easy for their shoppers to find complete maternity sets. While shoppers receive a fast, single-click shopping experience, BLANQI enjoys higher order amounts without investing any additional resources.
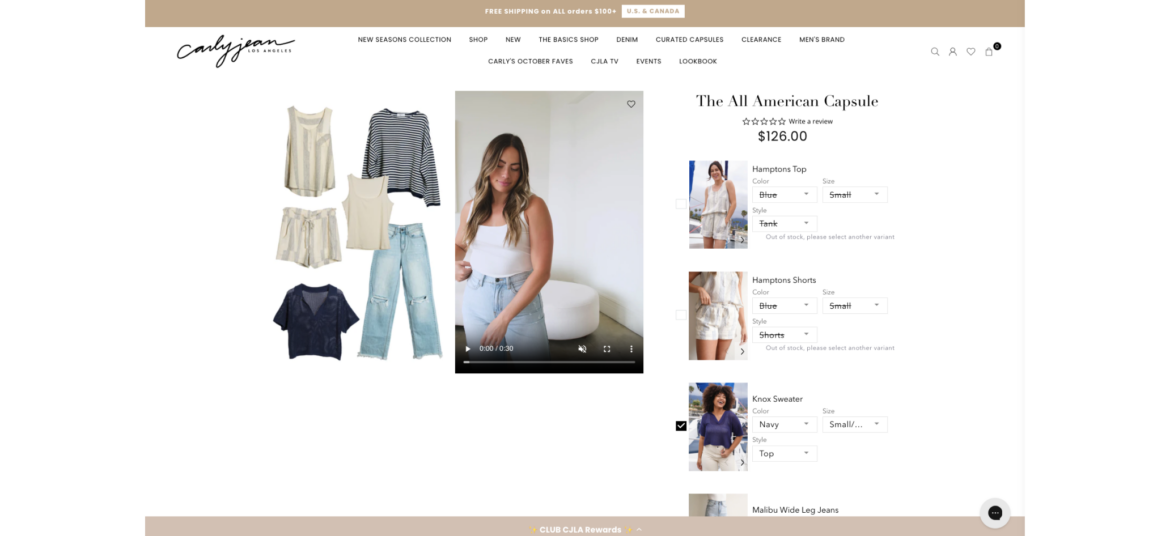
Offer shoppers the ability to create their own bundle of products by selecting from a range of available options
What is Build Your Own Bundle?
Build Your Own Bundle scenario provides shoppers with the flexibility to select specific items or features that best meet their individual needs and preferences. The selection is based on a pre-curated set of products by the merchant.
Why are brands using it?
Increase AOV - encourage higher spending with customizable bundles, raising average order values and revenue
Personalize purchases - tailor products to customer preferences, potentially increasing Average Order Value (AOV) and overall revenue
Stand out competitively - offer a unique option, attracting customers looking for customized solutions
How Carly Jean uses Build Your Own Bundle
Carly Jean offers its shoppers the opportunity to build their own custom looks by selecting the individual items that comprise their desired outfit. 'Build Your Own Bundle' enables Carly Jean to easily provide a personalized experience that shoppers love and want to return to again and again.
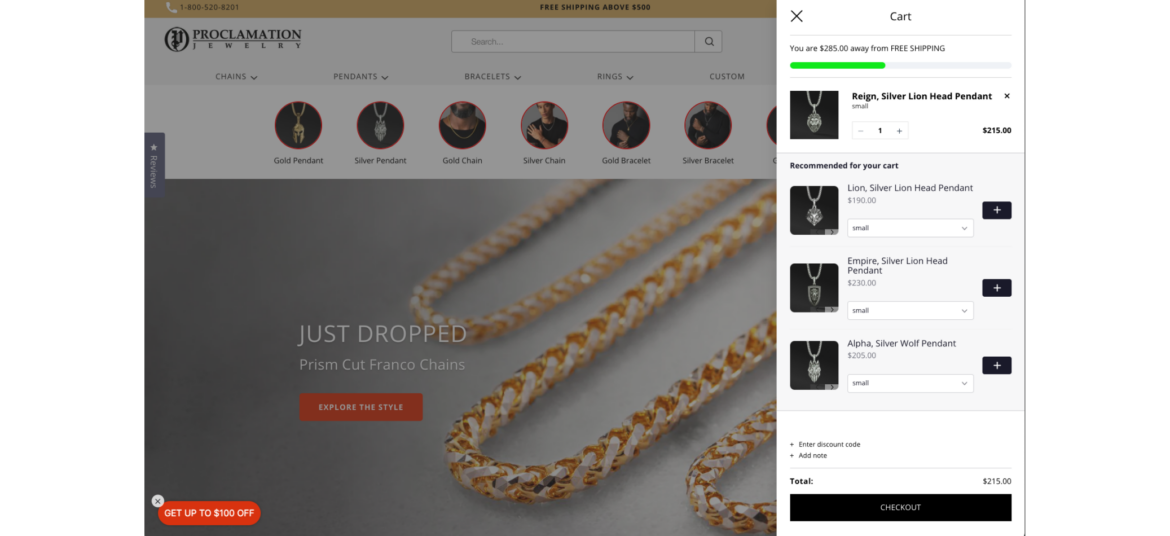
Encourage shoppers to spend a certain amount of money (X) in order to receive a specific benefit or reward (Y)
What is Spend X Get Y?
"Spend X, Get Y" promotions are designed to motivate shoppers to spend more money with the promise of receiving something valuable in return. It's a win-win situation where customers get a benefit, and the store increases its sales.
Why are brands using it?
Promotes larger purchases - motivates shoppers to spend more to qualify for the promotion, potentially leading to bigger transactions
Increases Average Order Value (AOV) - encourages higher spending, leading to a higher average transaction value
Proclamation Jewelry encourages its shoppers to spend at least $500 on jewelry in-store to receive free shipping. This is a win-win for both the shoppers, who get free shipping (which can be expensive at times), and the brand, which maintains a higher average order value.