18 Essential E-commerce Metrics + KPIs to Track in 2023
5 minutes
Table of Contents
Building a successful online business requires entrepreneurs to have the clearest idea possible about their current situation. Metrics and KPIs are the best way that business owners can keep track of their business’s performance.
With so many indicators, indexes, metrics, factors, and data, it can be hard to figure out which ones work best for your business. In this article, we are going to explore the 18 essential e-commerce metrics and KPIs you want to track in 2023. This list will help you build a solid analytics foundation that will keep your e-commerce site humming long.
What are E-commerce Metrics?
In essence, e-commerce metrics are data that allow you to analyze your business’s performance. Without analytics, you lack quantifiable data to make informed and objective decisions. As a result, you will most likely make decisions based on hunches and guesses. Needless to say, that’s not the most effective way to run your e-commerce site.
The main purpose of e-commerce metrics is to produce data for decision-making. Above all, we want to make the decision-making process as analytics-based as possible. As a result, using metrics can help you get the data you need to make informed decisions.
What are E-commerce KPIs?
Key performance indicators (KPIs) are data you can use to make specific decisions. Like metrics, KPIs are quantifiable measurements that aid decision-making.
So, aren’t metrics and KPIs the same thing?
Methodologically, they are. Practically, they are not.
Metrics and KPIs are pieces of quantifiable data that are used for analytical purposes. They provide objective nada to aid decision-making.
Metrics and KPIs are different for two specific reasons.
First, metrics are general measurements of an e-commerce site’s performance. For instance, total sales represent a general analysis of an e-commerce site’s performance. While total sales aid decision-making, it’s not a specific indicator that tells business owners how to react.
Second, KPIs are highly specific metrics that can trigger specific decisions. For example, a stock count is a KPI that triggers purchasing decisions. Some companies automatically generate purchase orders when their stock counts reach 25%. Thus, stock counts are KPIs since they trigger a specific action or reaction.
Why are E-commerce Metrics and KPIs Important for Your Business?
There are three key reasons why e-commerce metrics and KPIs are crucial to your business.
#1: Promote efficiency
Knowing which e-commerce performance metrics to track allows you to reduce wasted resources, lost time and boost overall performance. These results are possible since e-commerce metrics allow you to visualize potential problems before they become serious issues. You can take proactive measures to correct issues in time.
#2: Reduce decision fatigue
Entrepreneurs face thousands of decisions daily. These decisions range from small to major issues. Therefore, decision fatigue is a real situation. Savvy business people know that automating as many decisions as possible is the best way to reduce decision fatigue.
E-commerce KPI benchmarks and performance indicators allow you to take the guesswork out of decision-making. The data can show you when to make a decision and when to wait. Also, e-commerce metrics facilitate difficult choices by providing objective data.
#3: Focus efforts
E-commerce metrics allow you to focus your efforts on the areas that truly matter. Without e-commerce KPIs benchmarks, you may have an idea of where things are going wrong.
You may intuitively know which areas require your attention. However, e-commerce performance metrics can reveal exactly where you need to pay close attention.
The 18 E-commerce Metrics and KPIs to Track in 2023
If you’re thinking about which e-commerce metrics and KPIs to track, don’t worry. We’ve got you covered. Here is the list of the top 18 e-commerce metrics and KPIs you must track in 2023.
A sales conversion rate consists of measuring the number of sales divided by the number of visits to an e-commerce site over a specific period.
For example, if 10 customers out of 100 purchase every hour, the sales conversion rate are 10%
(10 / 100 = 0.10 or 10%).
Knowing your sales conversion rate can easily help you assess your e-commerce site’s performance. It can also help you determine if you’re hitting your targets.
#2: Average order value
Average order value is an e-commerce performance metric that shows you the average dollar value of each order. To calculate your e-commerce site’s average order value, divide the total income by the number of sales in a specific period.
For instance, your e-commerce site sells $100 to 5 customers every hour. Your average order value is $20 per hour (100 / 5 = 20).
#3: Customer lifetime value
This e-commerce performance metric allows you to determine a customer’s long-term value. This e-commerce metric can be used to view past and future customer value.
For example:
Take a customer’s purchase history over a specific period, such as a month
Then, add the total number of orders and income in a month
You can now calculate this customer’s average order value
To project customer lifetime value, multiply the customer’s average order value by the number of orders and then by the number of months you want to project.
Consider this example:
A customer spends $10 per order on 5 orders per week. That’s $50 a week. If you want to know your customer’s lifetime value, multiply by four weeks. That’s $200. This e-commerce metric indicates that you make $200 if that customer purchases for four weeks.
#4: Customer acquisition cost
This e-commerce KPI indicates how much it costs you to get a new customer. This e-commerce metric is fairly straightforward.
Let’s assume you spend $100 on ads every week.
You get 10 new customers in a week.
Your customer acquisition cost is $10 for every new customer (100 / 10 = 10).
Knowing your customer acquisition helps you determine how effective your advertising spend is. As a result, you may choose to increase or cut back based on your business’s overall performance.
#5: Cart abandonment rate
This e-commerce metric is a biggie. Your e-commerce site’s cart abandonment tells you how many customers add items to their cart but don’t follow through on a purchase. Typical cart abandonment rates range between 60% to 80%.
To determine your cart abandonment rate, take the number of the total purchase and subtract them from the total number of carts created. Then, divide this number by the total number of carts (total # of carts – total sales = number of abandoned carts. Then, number of abandoned carts / total carts created).
Your cart abandonment can tell you much about your e-commerce site’s overall performance and areas to focus on.
For instance:
100 total carts created – 10 total sales = 90 abandoned carts
Total abandoned carts / total carts created = 90 / 100 = 0.90 or 90%
You have a cart abandonment of 90%
#6: Returning customer rate
This e-commerce KPI tells you how many of your total customers are existing ones. Please remember that the 80/20 rule states that 80% of your sales come from 20% of your customers. This 20% are generally your returning customers.
To determine your returning customer rate:
Take the number of total sales and subtract the number of new customers
Take the number of returning customers and divide it by total sales
For example, 100 total sales feature 50 returning customers
So, 100 – 50 = 50. Then, 50 / 100 = 0.50 or 50%
You have a returning customer rate of 50%
Please remember that it’s always much cheaper to sell to existing customers than to get new ones!
#7: Bounce rate
Your e-commerce site’s bounce rate consists of the number of visitors you get in a specific period but then leave without doing anything on your site. Google Analytics can help you get this rate by checking out the “audience” section.
Please note that bounce rates typically range between 20% to 45%. Ideally, you want customers to stick around as long as possible. So, try your best to create an e-commerce site that entices customers to browse. Please remember that the longer customers stay, the more they buy.
#8: Net promoter score
The net promoter score is a technical term for the e-commerce metric that measures customer loyalty. You can use a survey to measure your e-commerce site’s net promoter score. Using a question such as, “On a scale of 1 to 10, how likely are you to tell your friends and family about us?”
In general, scores close to 10 indicate your customers are promoters. Scores under 6 mean your customers are detractors.
To calculate the net promoter score, subtract the number of detractors from the number of promoters. So, if you have 100 customers, where 90 are promoters and 10 are detractors, you have a net promoter score of 80%.
Your net promoter score can be a good way to determine if your customer loyalty tactics are working. If not, you can always improve ways to boost customer loyalty.
#9: Click-through rate
The click-through rate refers to the number of clicks you get on your advertising materials. For example, you send 100 emails to the subscribers on your mailing list. However, only 5 clicked on the link provided in the email. This means that your click-through rate is 5% (5 / 100 = 0.05 or 5%).
Please note that the click-through rate is an e-commerce metric that tracks links on emails, social media, and any other link you provide in your advertising campaigns.
#10: Traffic source
Traffic source is a key e-commerce performance metric to track closely. Traffic source tells you where your customers are coming from. There are various traffic sources: web search (i.e., Google), direct links, social media, email, affiliate links, and video streaming (e.g., YouTube).
This e-commerce metric tells you where your customers find you. Also, it can help you determine where you need to focus your efforts to attract more customers.
If your e-commerce site runs on Shopify, you can check this information easily on your Shopify dashboard. Your traffic source is one of the e-commerce metrics for Shopify you can’t miss!
#11: Sessions by device type
Like traffic source, the number of sessions by device type tells you from which devices your customers access your site. In general, there are two types of devices: desktop and mobile. Your Shopify analytics section tells you the session by device type.
This e-commerce metric for Shopify will help you focus your efforts on providing a great customer experience. For instance, if your customers predominantly access your site from mobile devices, you want to ensure that your e-commerce looks great on phones and tablets.
#12: Sessions by location
This e-commerce metric tells you the geographic location of your customers. This data is extremely important as it may reveal interesting insights about your store’s popularity.
Also, it can help you determine places you may want to focus your efforts on. You can find this data in your Shopify dashboard.
#13: Stock count
Your stock count is crucial in running your business. After all, the last thing you want is to run out of stock. You can include a stock counter function on Shopify to alert you whenever stock falls below a specific threshold and assist with inventory management.
Consequently, you can issue purchase orders to replenish your stock. Typically, alerts trigger at 25% and 15%. However, you may trigger alerts at higher thresholds (30% or more) if products are harder to source or take longer to ship.
#14: Average units sold
This highly useful e-commerce metric tells you how many units you sell per specific period, such as hourly, daily, weekly, monthly, quarterly, and annually. Knowing your average units sold can help you plan your stock counts.
For example, if your top product sells 10 units a day, 100 units should cover 10 days. If your product takes 2 days to arrive, you may want to set your stock alert at 20% to give you enough time to replenish your stock.
#15: Top-selling products
This e-commerce KPI is straightforward. Knowing which products sell the best enables you to determine where you make the most money. In particular, knowing your top-selling products helps you maximize your stock efficiency by loading up on products you know will sell. Furthermore, you can discount slow-sellers or eliminate them from your catalog.
To determine your top-selling products, look at your orders and stock counter. Shopify facilitates tracking this e-commerce metric. If done manually, you may need to go through orders and input them into a spreadsheet to visualize your top-sellers.
#16: Social media engagement
What’s a good list of e-commerce metrics without social media engagement? Social media engagement refers to the number of likes, subscriptions, clicks, views, and shares you get from your social media content.
In particular, your social media engagement rate is a measure of your marketing campaigns’ effectiveness.
You can track this e-commerce metric per hour, day, or week. For instance, you can track the number of views you get on YouTube videos per hour. Also, you can track the number of likes you get on a Facebook or Instagram post.
#17: Refund rate
The refund rate is a biggie. This e-commerce KPI tells you the number of dissatisfied customers by the number of refunds you must issue.
To calculate the refund rate, take the number of refunds in a period and divide it by the total number of sales. For instance, if you issue ten refunds a month out of a total of 1,000 sales, you have a refund rate of 1% (10 / 1000 = 0.001).
Please note that a refund rate of over 1% is too high. The goal is to keep your refund rate as close to 0% as possible.
#18: Subscription rate
Lastly, we must consider your subscription rate. This e-commerce KPI measures the number of subscribers you get to your newsletter or mailing list out of the total number of visits you get in a period.
For instance, you get 1,000 visits per hour. You also get 100 new subscribers an hour. That’s a subscription rate of 10% (100 / 1,000 = 0.10 or 10%).
However, a more accurate calculation is the number of non-subscribers compared to the number of subscriptions. This specific e-commerce metric may be hard to track. Your Shopify analytics, however, can help you track unique visits. From there, you can calculate your subscription rate by looking at the number of new subscribers.
Your subscription rate is a good indicator of your e-commerce site’s attractiveness and engagement.
How can PickyStory Help Boost your E-commerce Metrics and KPIs?
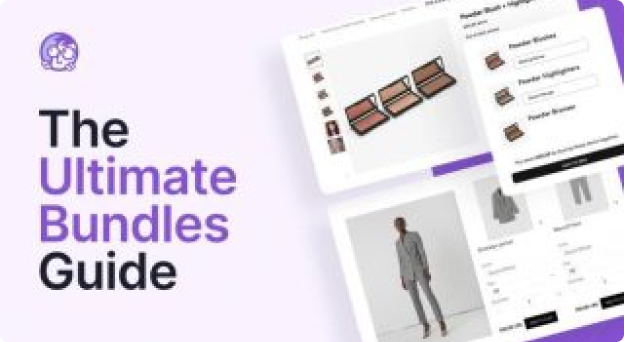
One of the most important KPIs on this list is AOV. If you’re looking to increase your store’s AOV, PickyStory has some amazing tools designed to help. With PickyStory, you can sell products in bundles and sets, making it easy for your customers to add more products to their orders.
Using e-commerce metrics and KPIs to track your online store’s performance is crucial. Knowing your top metrics will help you make savvy business decisions. With PickyStory, you have the winning combination in your hands. Use your e-commerce metrics to track performance, and use PickyStory to take your e-commerce site to the next level.
Present bundles of products that are frequently purchased together, simplifying the decision-making process for your customers
What is Frequently Bought Together?
It is a recommendation scenario that suggests additional products to the shopper, which are often purchased by other customers in conjunction with the item they are currently viewing or considering purchasing.
Why are brands using it?
Boosted sales and revenue - increases average order value by suggesting complementary products, leading to higher sales
Simplified customer experience - saves time and effort for customers by offering relevant product recommendations, enhancing satisfaction and loyalty
Cross-selling opportunities: "Frequently Bought Together" creates opportunities for cross-selling, allowing brands to introduce shoppers to a wider range of products
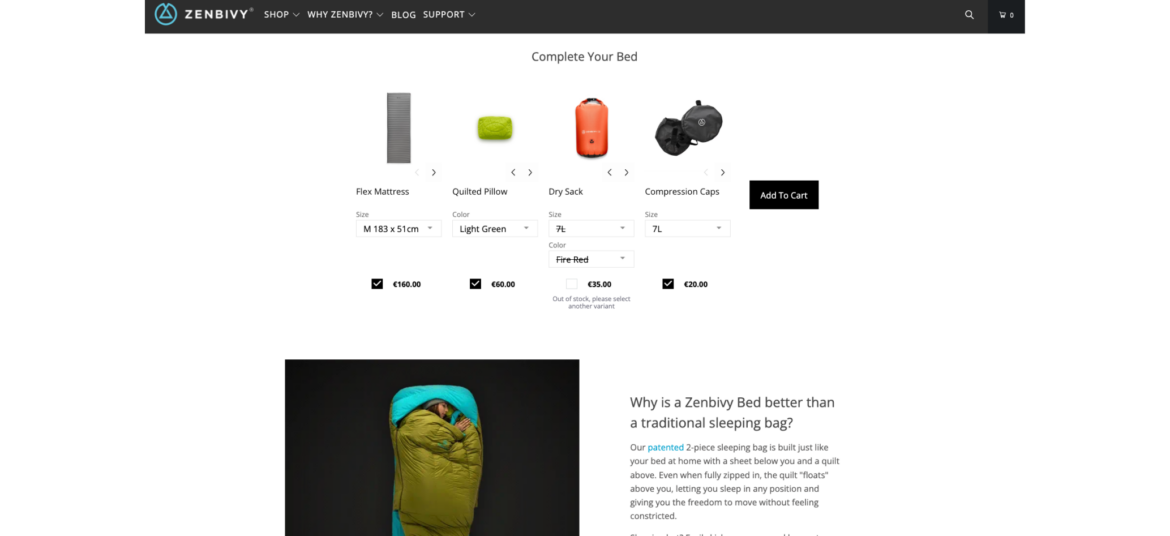
How Zenbivy uses Frequently Bought Together
Zenbivy simplifies the shopping experience by displaying all the needed pieces of its sleeping systems on one page, under each product that is part of a sleeping system. This way, shoppers don't need to go through multiple pages and guess what goes with what. Zenbivy enjoys much larger orders, and shoppers can have a seamless experience.
Offer shoppers the ability to create their own bundle of products by selecting from a range of available options
What is Build Your Own Bundle?
Build Your Own Bundle scenario provides shoppers with the flexibility to select specific items or features that best meet their individual needs and preferences. The selection is based on a pre-curated set of products by the merchant.
Why are brands using it?
Increase AOV - encourage higher spending with customizable bundles, raising average order values and revenue
Personalize purchases - tailor products to customer preferences, potentially increasing Average Order Value (AOV) and overall revenue
Stand out competitively - offer a unique option, attracting customers looking for customized solutions
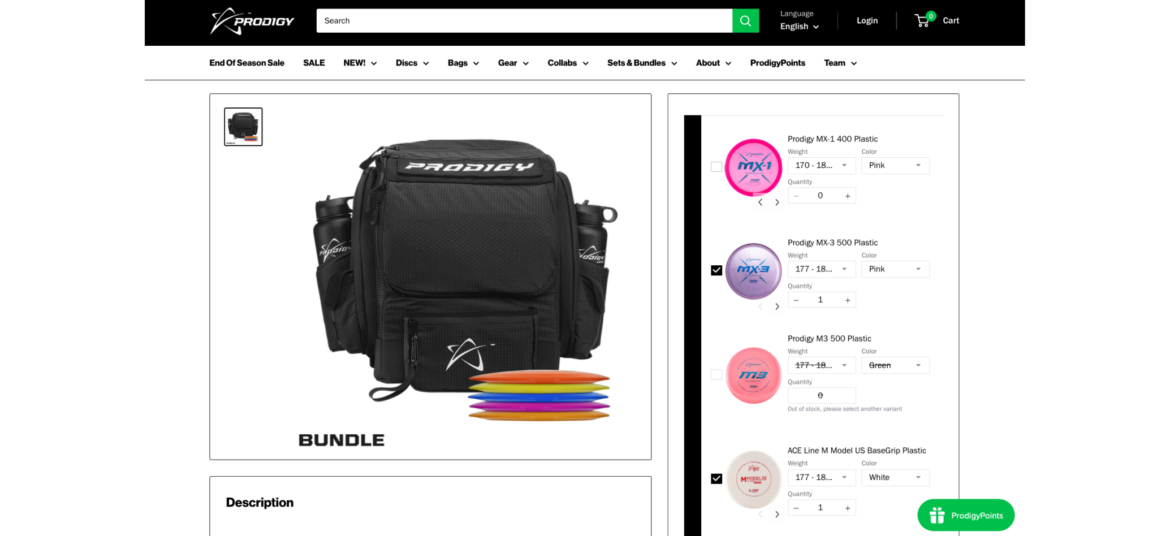
How Prodigy uses Build Your Own Bundle
Prodigy enables its shoppers to build their own bundle of golf discs, fully personalizing the shopping experience. Shoppers get an easy way to select their favorite discs while Prodigy consistently increases its AOV.
Combine multiple individual products into a bundle and sell them as a single unit
What is Bundle as Product?
Bundle as Product scenario involves bundling multiple individual products together and selling them as a single unit. This strategy offers shoppers a curated selection of items that work together or complement each other.
Why are brands using it?
Increase sales and revenue. Bundling leads to higher sales volumes and greater revenue due to the perceived cost-effectiveness.
Highlight the value and convenience of purchasing a set of items together, enticing them with an irresistible offer
Enhance value perception. Bundles create the perception of added value, making them more appealing to customers.
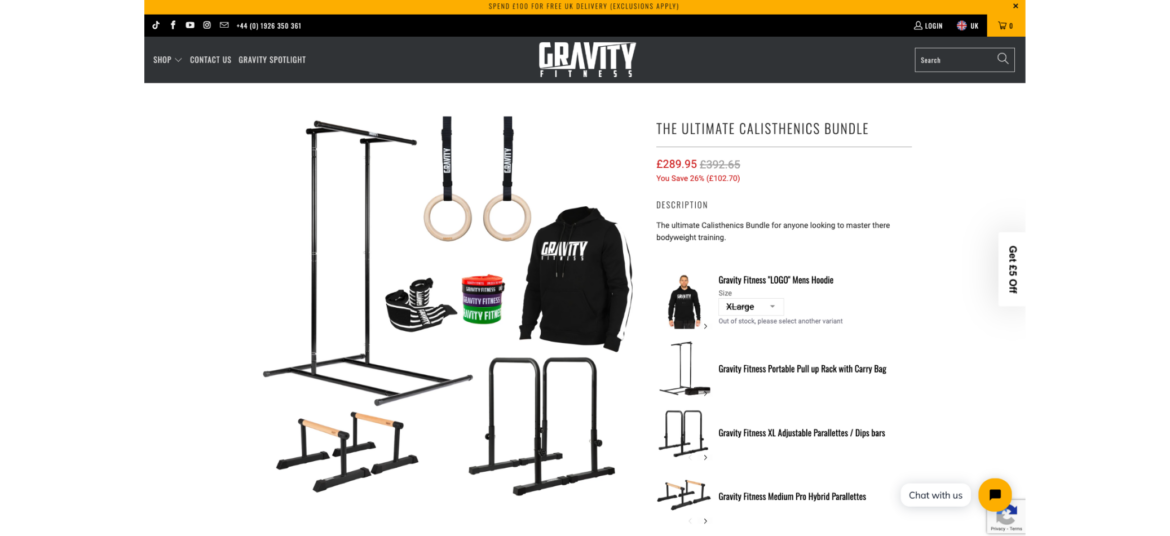
How Gravity Fitness uses Bundle as Product
Gravity Fitness knows that it's not an easy task for shoppers to collect all the required pieces for a complete home gym. That's why they have created pre-made home gym bundles for an easy shopping experience. Now they have fewer SKU issues, a higher AOV, and happier customers.
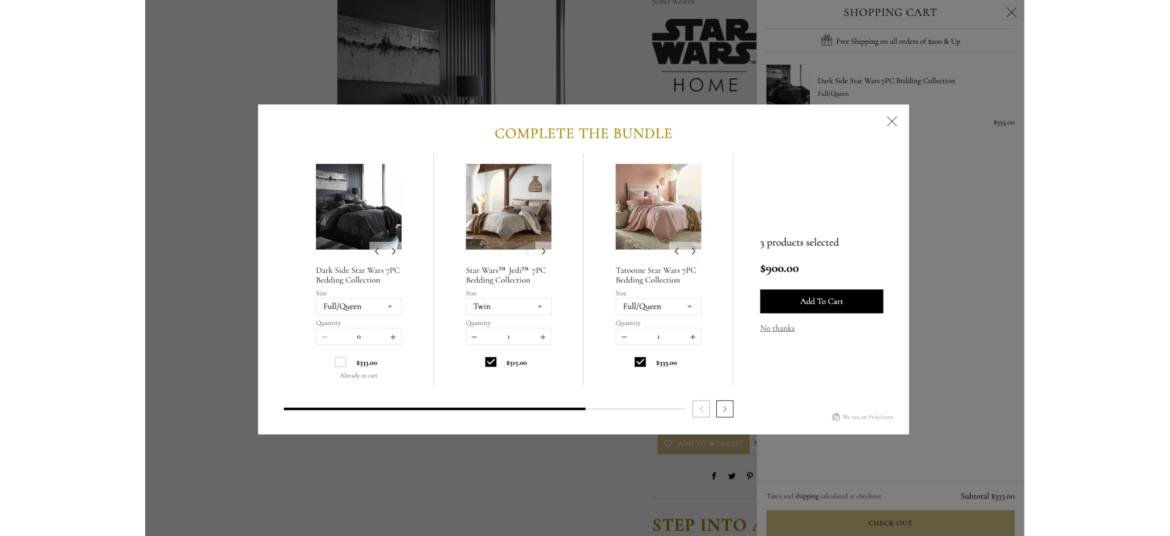
Encourage shoppers to add the missing items to complete the bundle when they add items to cart
What is Complete the Bundle?
Complete the Bundle popup is a deal that appears when a shopper has added some items to their shopping cart but has not yet added all the recommended or related products that typically go together.
Why are brands using it?
Increase Average Order Value (AOV) - encourage shoppers to add complementary products, leading to higher total purchases
Highlight the value and convenience of purchasing a set of items together, enticing them with an irresistible offer
Enhance value perception. Bundles create the perception of added value, making them more appealing to customers.
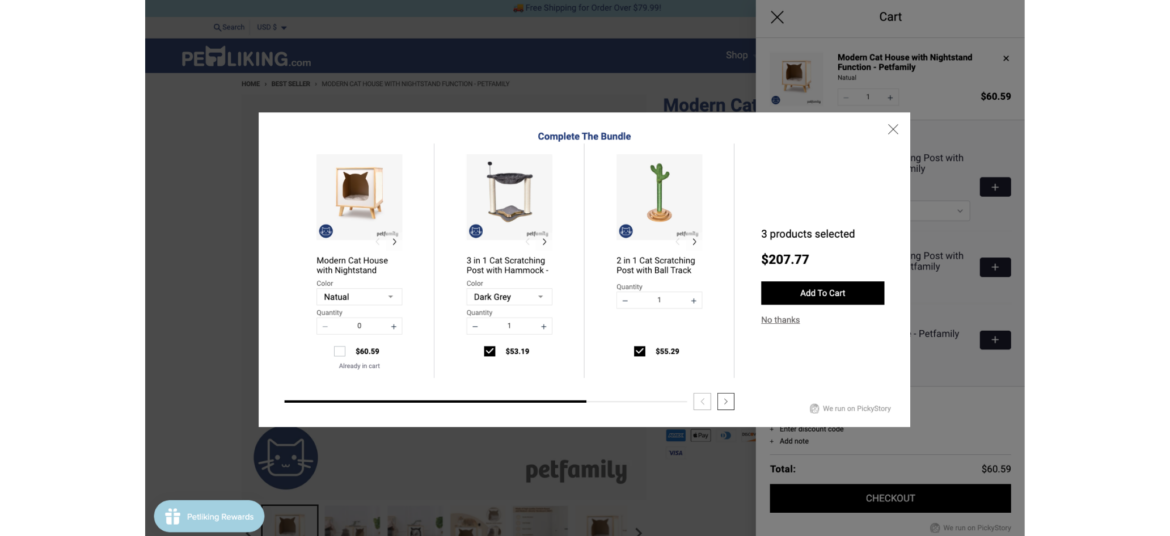
How Petliking.com uses Complete the Bundle
Petliking.com never misses an opportunity to offer more products to its shoppers after they add an item to cart. By offering to complete the bundle, Petliking.com helps shoppers to discover additional related items that complement each other while increasing its order size.
Combine multiple individual products into a bundle and sell them as a single unit
What is Bundle as Product?
Bundle as Product scenario involves bundling multiple individual products together and selling them as a single unit. This strategy offers shoppers a curated selection of items that work together or complement each other.
Why are brands using it?
Increase sales and revenue. Bundling leads to higher sales volumes and greater revenue due to the perceived cost-effectiveness.
Highlight the value and convenience of purchasing a set of items together, enticing them with an irresistible offer
Enhance value perception. Bundles create the perception of added value, making them more appealing to customers.
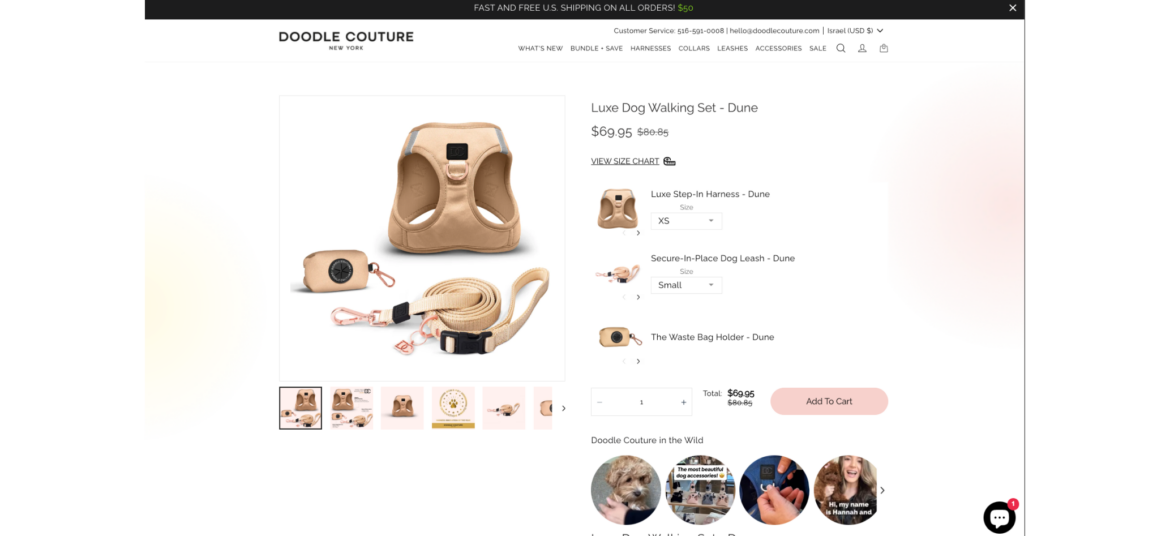
How Doodle Couture uses Bundle as Product
Doodle Couture makes it so easy for shoppers to equip their best friend with the required outfit. Instead of moving back and forth between pages, Doodle Couture offer a complete bundle for pets on one page with a single click. This boosts AOV while making the shopper happy.
Encourage shoppers to add the missing items to complete the bundle when they add items to cart
What is Complete the Bundle?
Complete the Bundle popup is a deal that appears when a shopper has added some items to their shopping cart but has not yet added all the recommended or related products that typically go together.
Why are brands using it?
Increase Average Order Value (AOV) - encourage shoppers to add complementary products, leading to higher total purchases
Highlight the value and convenience of purchasing a set of items together, enticing them with an irresistible offer
Enhance value perception. Bundles create the perception of added value, making them more appealing to customers.
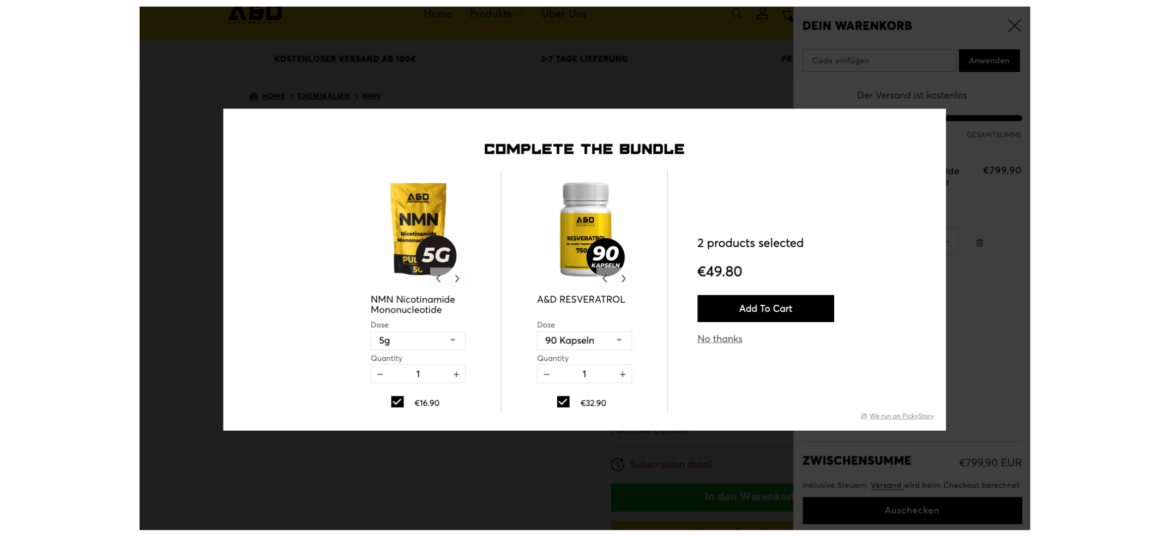
How A&D Performance uses Complete the Bundle
A&D Performance always seizes intent-based opportunities to offer additional supplements when shoppers add items to their cart. By displaying a 'Complete the Bundle' popup, A&D Performance increases their Average Order Value (AOV) while helping their customers discover more products.
Combine multiple individual products into a bundle and sell them as a single unit
What is Bundle as Product?
Bundle as Product scenario involves bundling multiple individual products together and selling them as a single unit. This strategy offers shoppers a curated selection of items that work together or complement each other.
Why are brands using it?
Increase sales and revenue. Bundling leads to higher sales volumes and greater revenue due to the perceived cost-effectiveness.
Highlight the value and convenience of purchasing a set of items together, enticing them with an irresistible offer
Enhance value perception. Bundles create the perception of added value, making them more appealing to customers.
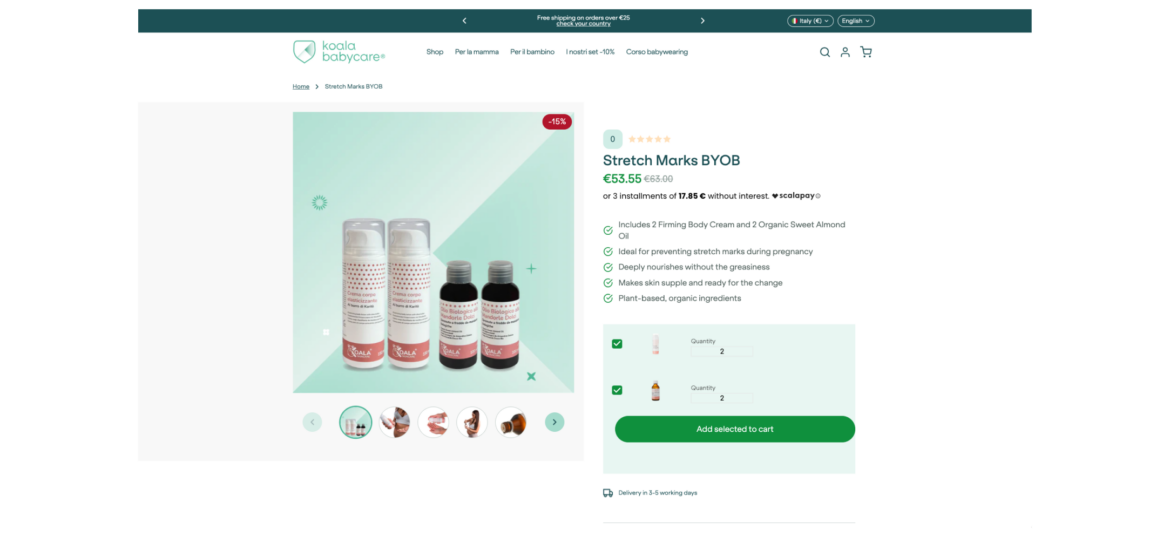
How Koala Babycare uses Bundle as Product
Koala Babycare simplifies its shoppers lives by offering complete cream & oil sets. Shoppers can easily pick their favorite bundles and save while Koala Babycare increases its AOV and number of orders.
Encourage shoppers to spend a certain amount of money (X) in order to receive a specific benefit or reward (Y)
What is Spend X Get Y?
"Spend X, Get Y" promotions are designed to motivate shoppers to spend more money with the promise of receiving something valuable in return. It's a win-win situation where customers get a benefit, and the store increases its sales.
Why are brands using it?
Promotes larger purchases - motivates shoppers to spend more to qualify for the promotion, potentially leading to bigger transactions
Increases Average Order Value (AOV) - encourages higher spending, leading to a higher average transaction value
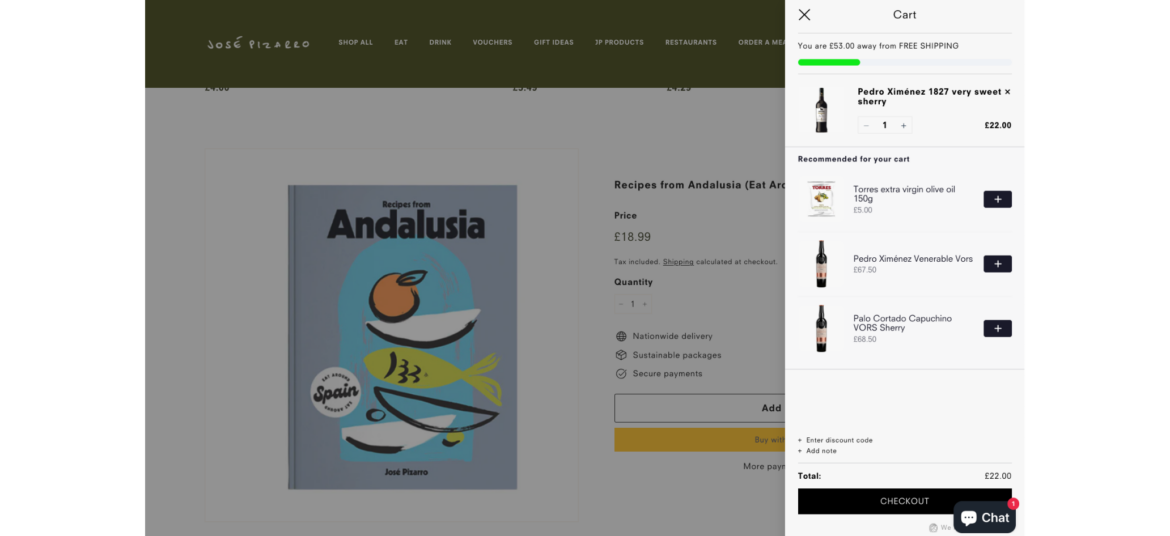
Jose Pizarro takes advantage of PickyCart and 'Spend X Get Y' to reward shoppers with free shipping when they spend £75 in-store. This is a win-win offer for both sides - while Jose Pizarro increases the AOV, shoppers receive a sweet reward.
Encourage shoppers to add the missing items to complete the bundle when they add items to cart
What is Complete the Bundle?
Complete the Bundle popup is a deal that appears when a shopper has added some items to their shopping cart but has not yet added all the recommended or related products that typically go together.
Why are brands using it?
Increase Average Order Value (AOV) - encourage shoppers to add complementary products, leading to higher total purchases
Highlight the value and convenience of purchasing a set of items together, enticing them with an irresistible offer
Enhance value perception. Bundles create the perception of added value, making them more appealing to customers.
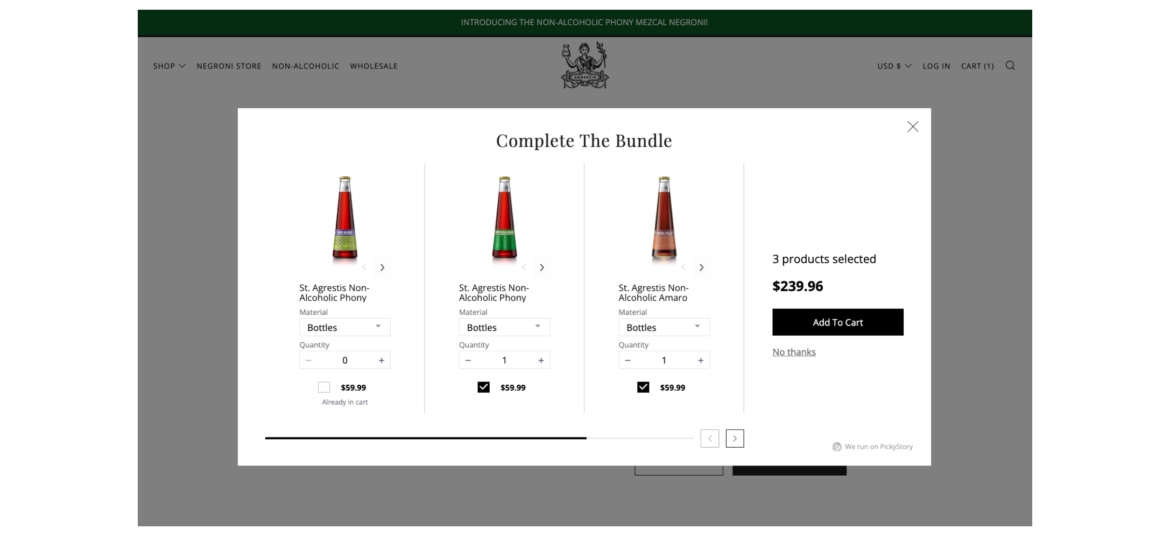
How Agrestis uses Complete the Bundle
Agrestis makes sure to consistently display a variety of spirits to their shoppers at the right moment. As shoppers add spirits to the cart, Agrestis extends an offer to include more related spirits, resulting in an improved shopping experience and a higher Average Order Value (AOV).
Offer shoppers the ability to create their own bundle of products by selecting from a range of available options
What is Build Your Own Bundle?
Build Your Own Bundle scenario provides shoppers with the flexibility to select specific items or features that best meet their individual needs and preferences. The selection is based on a pre-curated set of products by the merchant.
Why are brands using it?
Increase AOV - encourage higher spending with customizable bundles, raising average order values and revenue
Personalize purchases - tailor products to customer preferences, potentially increasing Average Order Value (AOV) and overall revenue
Stand out competitively - offer a unique option, attracting customers looking for customized solutions
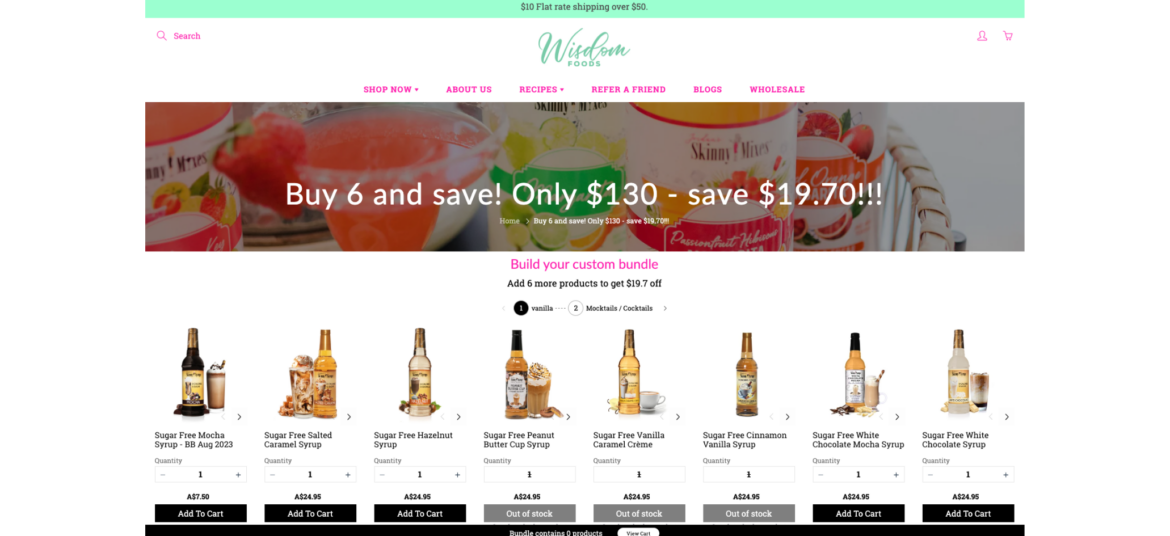
How Wisdom Foods uses Build Your Own Bundle
Wisdom Foods wanted to upgrade its shopping experience by making it easy for shoppers to pick their desired syrups. Now it allows shoppers to build their own bundles of syrups from a single page and checking out. This increases Wisdom Foods' order sizes while providing a personalized experience to their shoppers.
Combine multiple individual products into a bundle and sell them as a single unit
What is Bundle as Product?
Bundle as Product scenario involves bundling multiple individual products together and selling them as a single unit. This strategy offers shoppers a curated selection of items that work together or complement each other.
Why are brands using it?
Increase sales and revenue. Bundling leads to higher sales volumes and greater revenue due to the perceived cost-effectiveness.
Highlight the value and convenience of purchasing a set of items together, enticing them with an irresistible offer
Enhance value perception. Bundles create the perception of added value, making them more appealing to customers.
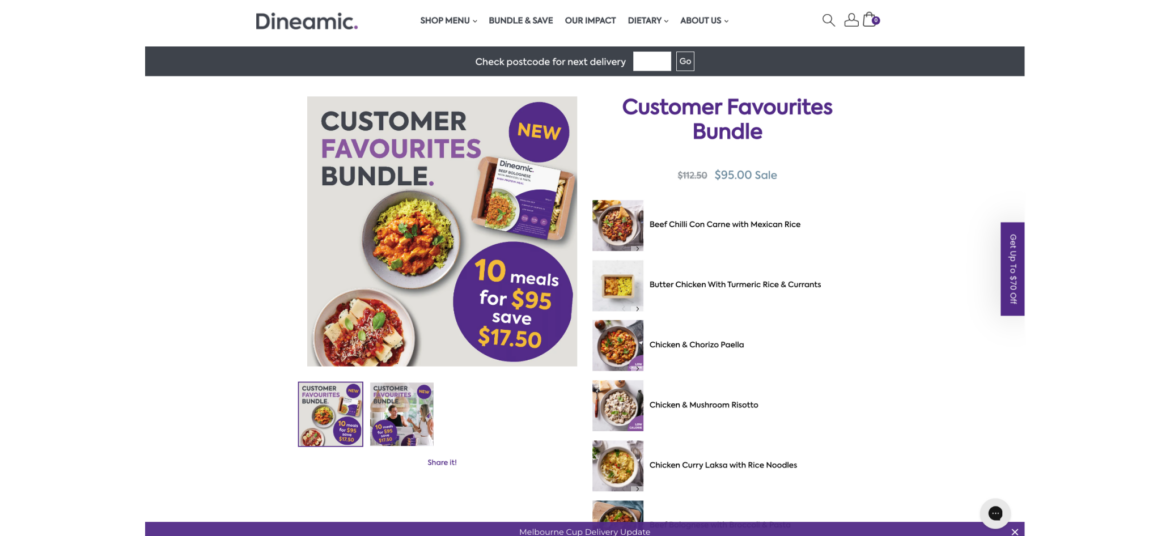
How Dineamic uses Bundle as Product
Dineamic takes advantage of bundles to package their pre-made meals by dietary requirements, so every shopper can quickly and easily find the desired category of meals and add them all with a single click. This simplifies the shopping experience and benefits both sides, as Dineamic boosts its Average Order Value (AOV).
Combine multiple individual products into a bundle and sell them as a single unit
What is Bundle as Product?
Bundle as Product scenario involves bundling multiple individual products together and selling them as a single unit. This strategy offers shoppers a curated selection of items that work together or complement each other.
Why are brands using it?
Increase sales and revenue. Bundling leads to higher sales volumes and greater revenue due to the perceived cost-effectiveness.
Highlight the value and convenience of purchasing a set of items together, enticing them with an irresistible offer
Enhance value perception. Bundles create the perception of added value, making them more appealing to customers.
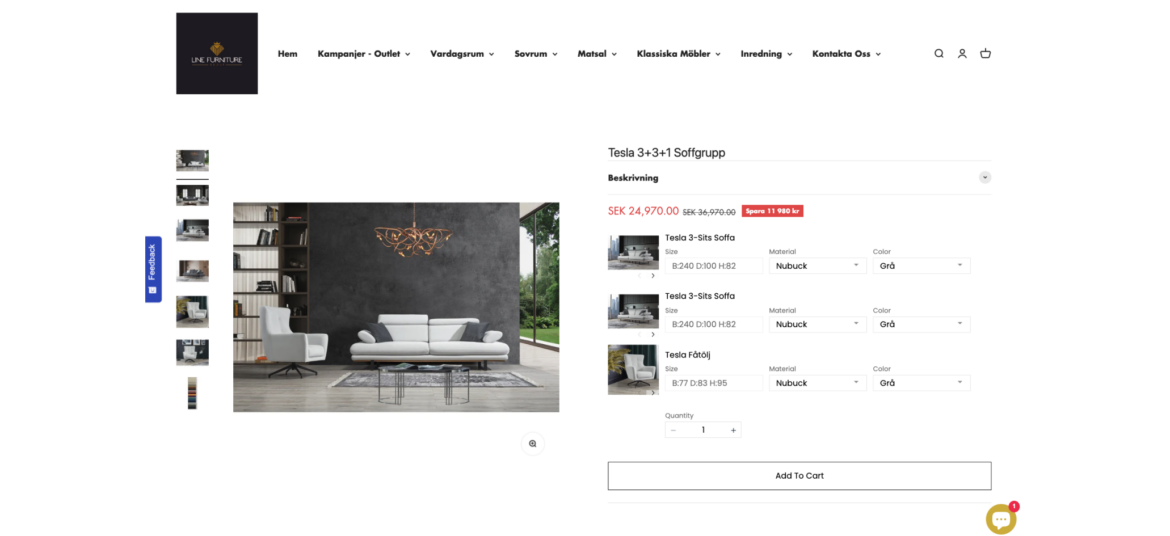
How Line Furniture uses Bundle as Product
Line furniture simplifies its shoppers lives by offering complete furniture sets in different styles. Now shoppers can easily find their favorite living room and save while Line Furniture increases its AOV and number of orders.
Encourage shoppers to add the missing items to complete the bundle when they add items to cart
What is Complete the Bundle?
Complete the Bundle popup is a deal that appears when a shopper has added some items to their shopping cart but has not yet added all the recommended or related products that typically go together.
Why are brands using it?
Increase Average Order Value (AOV) - encourage shoppers to add complementary products, leading to higher total purchases
Highlight the value and convenience of purchasing a set of items together, enticing them with an irresistible offer
Enhance value perception. Bundles create the perception of added value, making them more appealing to customers.
How Sobel Home uses Complete the Bundle
Sobel Home never misses an opportunity to offer more products to its shoppers after they add an item to cart. By offering to complete the bundle, Sobel Home helps shoppers to discover additional related items that complement each other while increasing its order size.
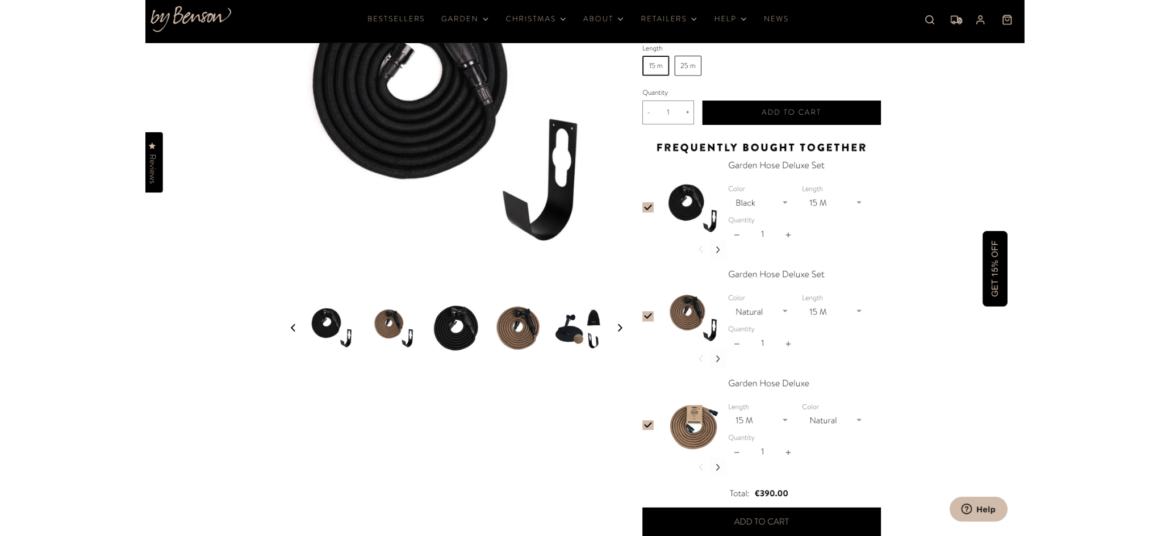
Present bundles of products that are frequently purchased together, simplifying the decision-making process for your customers
What is Frequently Bought Together?
It is a recommendation scenario that suggests additional products to the shopper, which are often purchased by other customers in conjunction with the item they are currently viewing or considering purchasing.
Why are brands using it?
Boosted sales and revenue - increases average order value by suggesting complementary products, leading to higher sales
Simplified customer experience - saves time and effort for customers by offering relevant product recommendations, enhancing satisfaction and loyalty
Cross-selling opportunities: "Frequently Bought Together" creates opportunities for cross-selling, allowing brands to introduce shoppers to a wider range of products
How By Benson uses Frequently Bought Together
By Benson never misses an opportunity to offer more options to its customers. While shoppers visit their product pages, they constantly offer to extend or upgrade the targeted product, resulting in better service and larger orders.
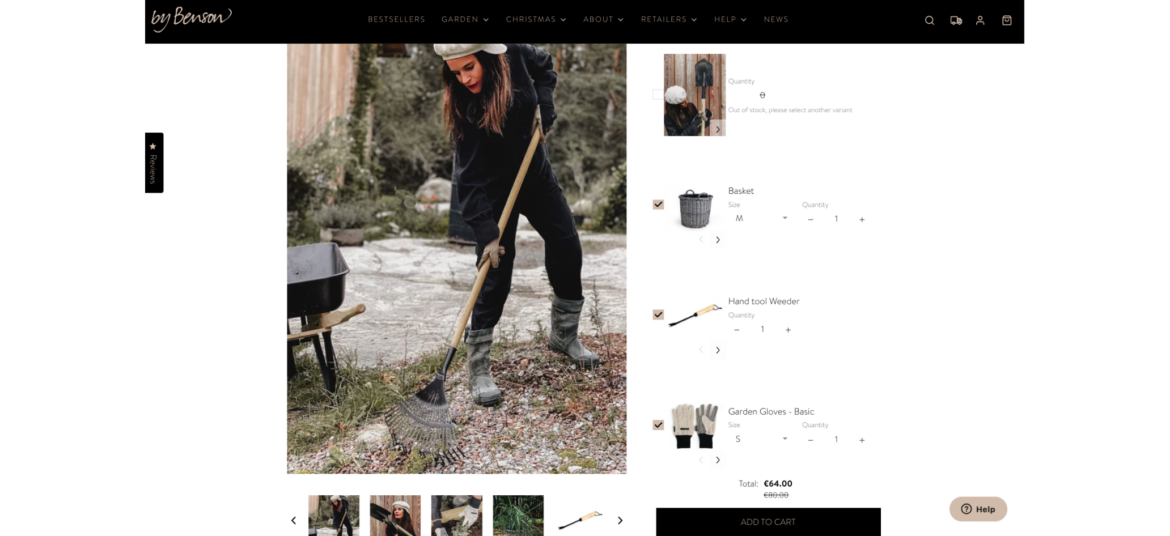
Offer shoppers the ability to create their own bundle of products by selecting from a range of available options
What is Build Your Own Bundle?
Build Your Own Bundle scenario provides shoppers with the flexibility to select specific items or features that best meet their individual needs and preferences. The selection is based on a pre-curated set of products by the merchant.
Why are brands using it?
Increase AOV - encourage higher spending with customizable bundles, raising average order values and revenue
Personalize purchases - tailor products to customer preferences, potentially increasing Average Order Value (AOV) and overall revenue
Stand out competitively - offer a unique option, attracting customers looking for customized solutions
How By Benson uses Build Your Own Bundle
As a professional destination for home gardeners, By Benson understands that it might be tricky to select all the necessary tools to make your garden shine. That's why By Benson helps its shoppers choose bundles of tools with a single click, while boosting their Average Order Value (AOV).
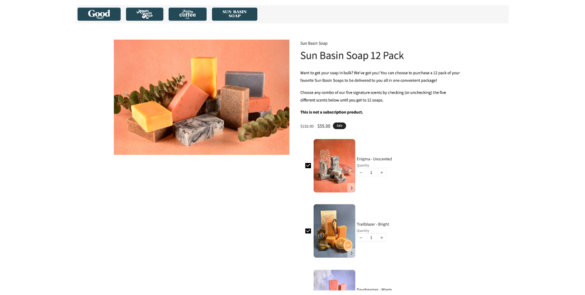
Offer shoppers the ability to create their own bundle of products by selecting from a range of available options
What is Build Your Own Bundle?
Build Your Own Bundle scenario provides shoppers with the flexibility to select specific items or features that best meet their individual needs and preferences. The selection is based on a pre-curated set of products by the merchant.
Why are brands using it?
Increase AOV - encourage higher spending with customizable bundles, raising average order values and revenue
Personalize purchases - tailor products to customer preferences, potentially increasing Average Order Value (AOV) and overall revenue
Stand out competitively - offer a unique option, attracting customers looking for customized solutions
How Good Store uses Build Your Own Bundle
Good Store encourages its shoppers to build their own custom bundles of soaps. They provide a variety of soaps to choose from and leave the selection itself to the shopper. This is fun, rewarding, and makes both sides happy.
Combine multiple individual products into a bundle and sell them as a single unit
What is Bundle as Product?
Bundle as Product scenario involves bundling multiple individual products together and selling them as a single unit. This strategy offers shoppers a curated selection of items that work together or complement each other.
Why are brands using it?
Increase sales and revenue. Bundling leads to higher sales volumes and greater revenue due to the perceived cost-effectiveness.
Highlight the value and convenience of purchasing a set of items together, enticing them with an irresistible offer
Enhance value perception. Bundles create the perception of added value, making them more appealing to customers.
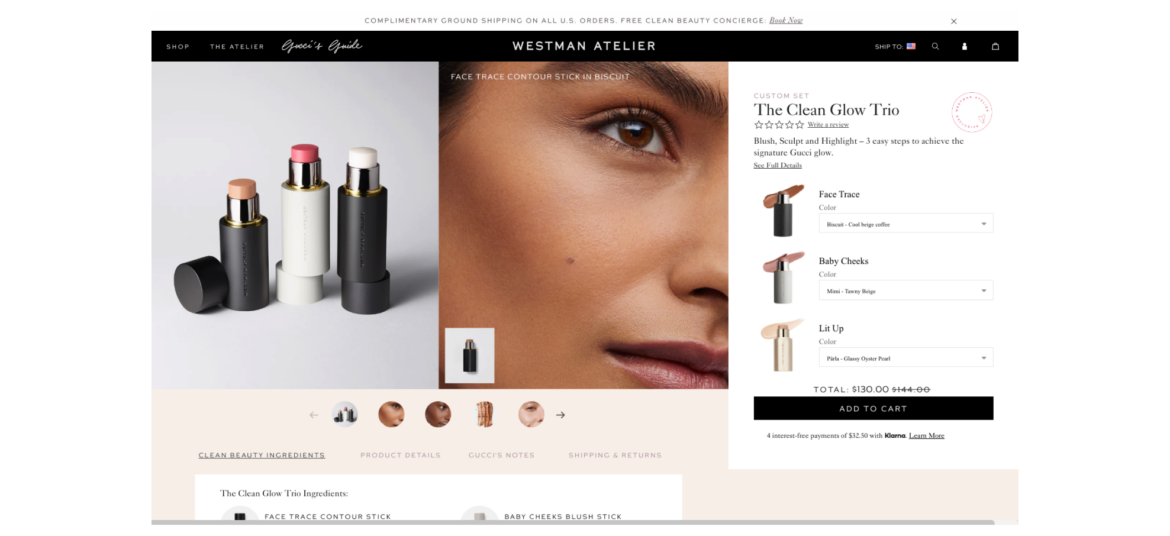
How Westman Atelier uses Bundle as Product
Westman Atelier understands that the attention span of the average shopper is quite short. Furthermore, with numerous options available, it's often easier to opt for a suggested bundle that's already curated for you.
Present bundles of products that are frequently purchased together, simplifying the decision-making process for your customers
What is Frequently Bought Together?
It is a recommendation scenario that suggests additional products to the shopper, which are often purchased by other customers in conjunction with the item they are currently viewing or considering purchasing.
Why are brands using it?
Boosted sales and revenue - increases average order value by suggesting complementary products, leading to higher sales
Simplified customer experience - saves time and effort for customers by offering relevant product recommendations, enhancing satisfaction and loyalty
Cross-selling opportunities: "Frequently Bought Together" creates opportunities for cross-selling, allowing brands to introduce shoppers to a wider range of products
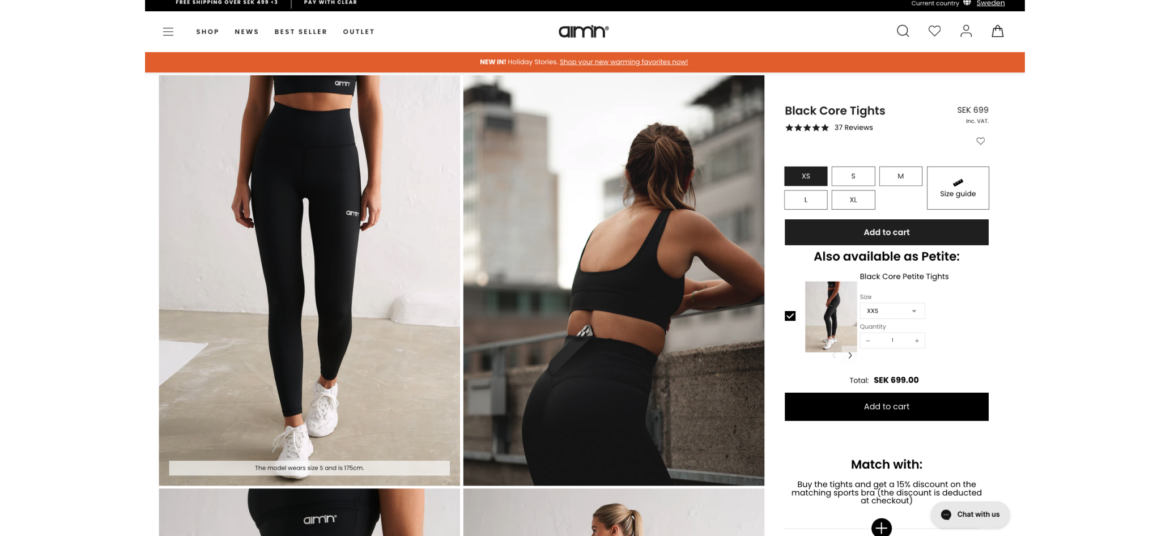
How Aim’n uses Frequently Bought Together
Aim'n never misses a shopper when it comes to its product pages. It utilizes the 'Frequently Bought Together' feature to suggest additional sizes to product viewers, ensuring that no shopper is left without a solution while keeping its main sizes as the default option.
Combine multiple individual products into a bundle and sell them as a single unit
What is Bundle as Product?
Bundle as Product scenario involves bundling multiple individual products together and selling them as a single unit. This strategy offers shoppers a curated selection of items that work together or complement each other.
Why are brands using it?
Increase sales and revenue. Bundling leads to higher sales volumes and greater revenue due to the perceived cost-effectiveness.
Highlight the value and convenience of purchasing a set of items together, enticing them with an irresistible offer
Enhance value perception. Bundles create the perception of added value, making them more appealing to customers.
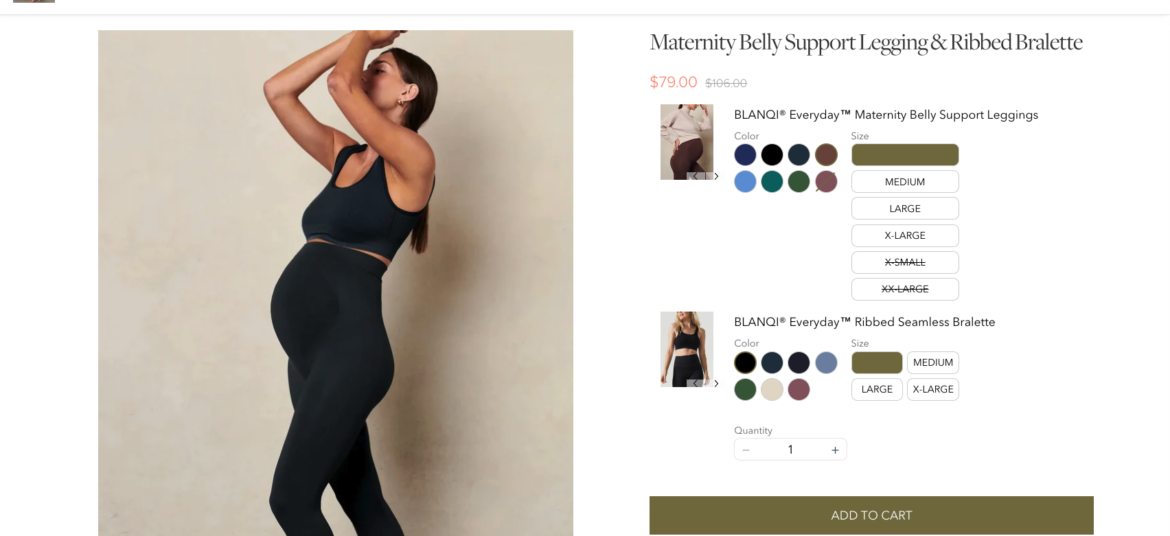
How BLANQI uses Bundle as Product
BLANQI make it easy for their shoppers to find complete maternity sets. While shoppers receive a fast, single-click shopping experience, BLANQI enjoys higher order amounts without investing any additional resources.
Offer shoppers the ability to create their own bundle of products by selecting from a range of available options
What is Build Your Own Bundle?
Build Your Own Bundle scenario provides shoppers with the flexibility to select specific items or features that best meet their individual needs and preferences. The selection is based on a pre-curated set of products by the merchant.
Why are brands using it?
Increase AOV - encourage higher spending with customizable bundles, raising average order values and revenue
Personalize purchases - tailor products to customer preferences, potentially increasing Average Order Value (AOV) and overall revenue
Stand out competitively - offer a unique option, attracting customers looking for customized solutions
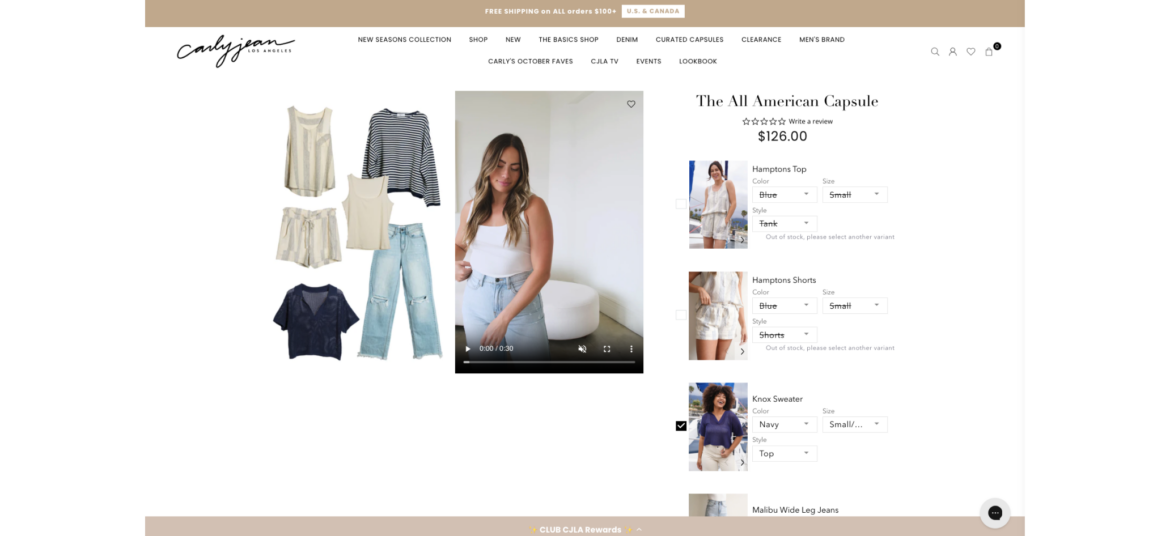
How Carly Jean uses Build Your Own Bundle
Carly Jean offers its shoppers the opportunity to build their own custom looks by selecting the individual items that comprise their desired outfit. 'Build Your Own Bundle' enables Carly Jean to easily provide a personalized experience that shoppers love and want to return to again and again.
Encourage shoppers to spend a certain amount of money (X) in order to receive a specific benefit or reward (Y)
What is Spend X Get Y?
"Spend X, Get Y" promotions are designed to motivate shoppers to spend more money with the promise of receiving something valuable in return. It's a win-win situation where customers get a benefit, and the store increases its sales.
Why are brands using it?
Promotes larger purchases - motivates shoppers to spend more to qualify for the promotion, potentially leading to bigger transactions
Increases Average Order Value (AOV) - encourages higher spending, leading to a higher average transaction value
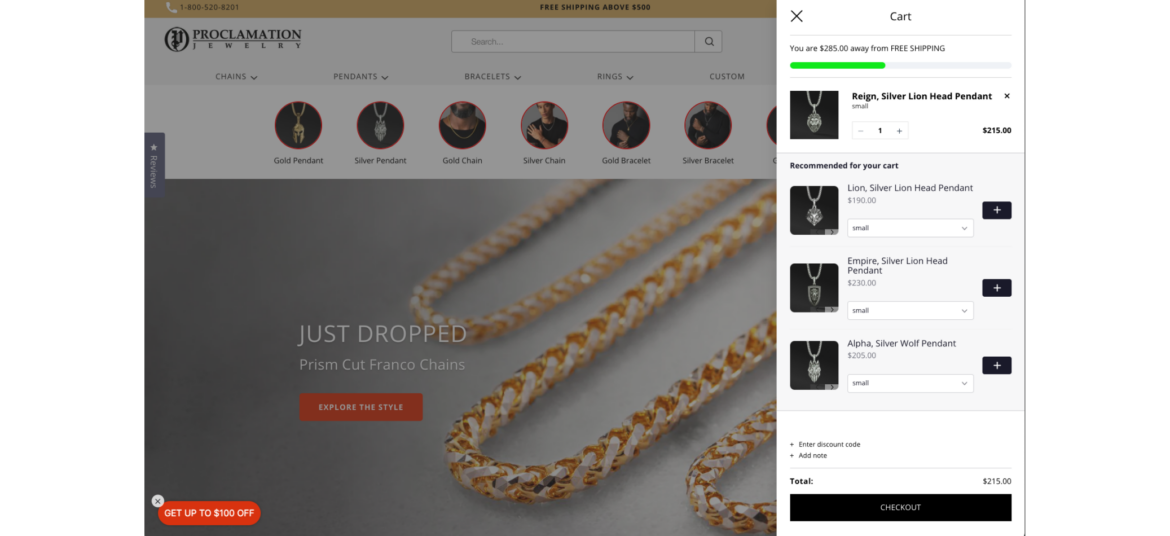
Proclamation Jewelry encourages its shoppers to spend at least $500 on jewelry in-store to receive free shipping. This is a win-win for both the shoppers, who get free shipping (which can be expensive at times), and the brand, which maintains a higher average order value.